
Figures & data
Table 1. Characteristics of the analysed sample.
Figure 1. Distribution of the Rockwoods scores in the 4,531 65+ evaluated.
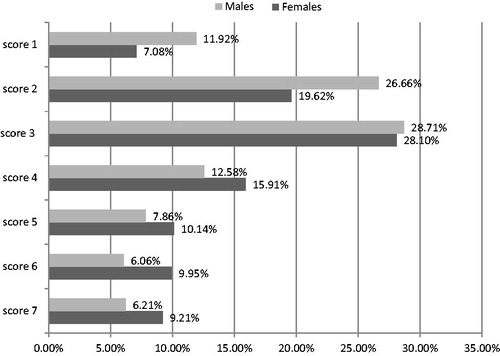
Table 2. Age- and sex-distribution of the prevalence of Frailty Status (so defined by a Rockwood score > 4) in the sample of 4,531 elderly individuals evaluated with the Rockwood Clinical Frailty Scale (% value and 95% confidence intervals).
Table 3. Prevalence of the state of frailty in some common chronic diseases.
Figure 2. Prevalences of mutually exclusive combinations of frailty and serious comorbidity.
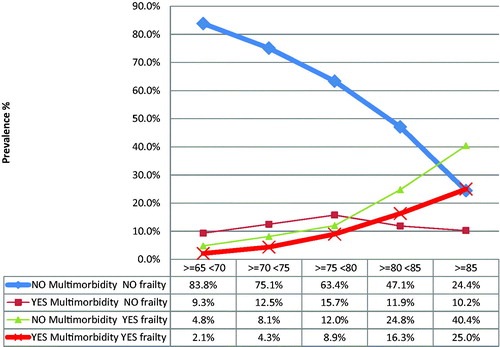
Table 4. Univariate and multivariate logistic regression models exploring the relationship between frailty (i.e. Rockwood score > 4) and comorbidity (i.e. Charlson Score ≥ 4).
Supplemental material