
Figures & data
Table 1. Patient and physician characteristics.
Figure 1. Mean PRO scores by number of fractures (n = 935). **ANOVA p < .0001. Abbreviations. EQ-5D, European Quality of Life 5 Domains; EQ-VAS, European Quality of Life Visual Analog Scale; OPAQ-SV, Osteoporosis Assessment Questionnaire short-version; PRO, patient-reported outcomes; SD, standard deviation. Number of patients in each group were as follows: overall, n = 935; 0 fractures, n = 750; 1 fracture, n = 145; ≥2 fractures, n = 40. Includes participants who completed all PROs and had values for all variables used in the analysis.
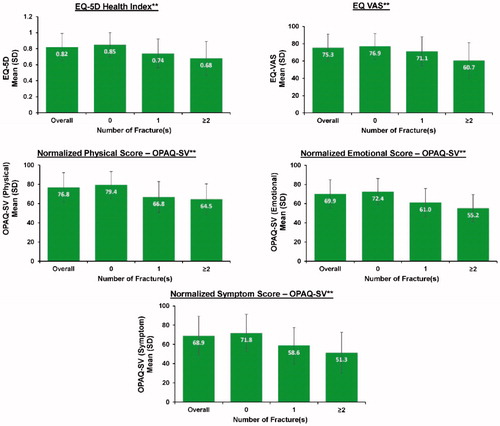
Figure 2. Mean PRO scores by site of most recent fracture (n = 185). *ANOVA p < .01; **ANOVA p < .0001. Abbreviations. EQ-5D, European Quality of Life 5 Domains; EQ-VAS, European Quality of Life Visual Analog Scale; OPAQ-SV, Osteoporosis Assessment Questionnaire short-version; PRO, patient-reported outcomes; SD, standard deviation. Number of patients in each group were as follows: overall, n = 185; wrist, n = 45; rib, n = 10; humerus, n = 3; other, n = 27; hip, n = 29; spine, n = 71.
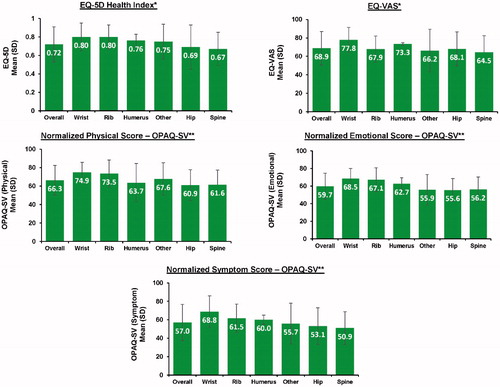
Table 2. Mean PRO scores by time since most recent fracture.
Table 3. Regression analysis for association between fracture site, time since fracture, and number of fractures with PROs in patients with fractures (n = 185)Table Footnotea.
Table 4. Regression analyses for association between the number of fractures and demographic and clinical variables with PROsTable Footnotea (n = 935)Table Footnoteb.
Table 5. Regression analyses for associations between the site of fracture and demographic and clinical variables with PROs in patients with fractures (n = 185)Table Footnotea.
Data availability statement
The data supporting the findings of this study are commercially available from the 2016 Adelphi US Osteoporosis Disease Specific Programme™. The analysis was conducted using Stata 15.1. Analysis of variance was conducted using command “oneway.” Regression analyses were conducted using command “regress,” with option “VCE cluster” to account for physician clustering. The Protocol Synopsis is available on request by contacting [email protected].