
Figures & data
Table 1. Demographics, clinical characteristics, and hospital characteristics of unmatched study cohorts.
Table 2. Demographics, clinical characteristics, and hospital characteristics of matched study cohorts.
Table 3. Unadjusted rates of readmissions, associated LOS, and hospital costs per patient of matched study cohorts.
Figure 1. Regression adjusted risks of all-cause, MB-related, and stroke-related readmissions for matched study cohorts. CI, confidence interval; MB, major bleeding.
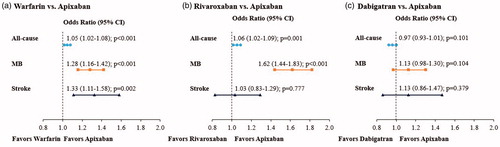
Table 4. Regression analyses─LOS and associated hospital cost for readmissions per patient of matched study cohorts: other oral anticoagulants (OACs) vs apixaban.