
Figures & data
Figure 1. Flow chart. CECC = conventional extracorporeal circulation; OPCAB = Off-pump coronary artery bypass surgery; PREOP = preoperative day; POD = postoperative day.
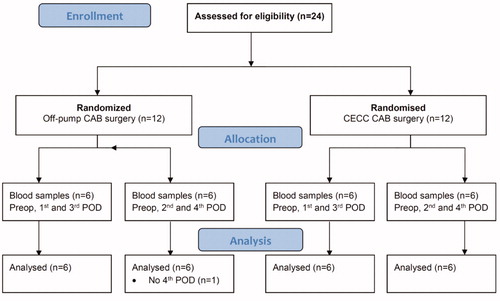
Table 1. Patient characteristics.
Figure 2. Plasma concentrations of oxycodone in the CECC-group with blood samples in the preoperative, and 1st and 3rd postoperative days.
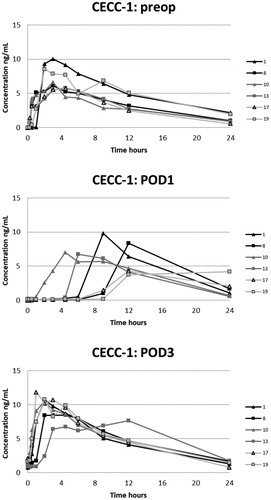
Figure 3. Plasma concentrations of oxycodone in the CECC-group with blood samples in the preoperative, and 2nd and 4th postoperative days.
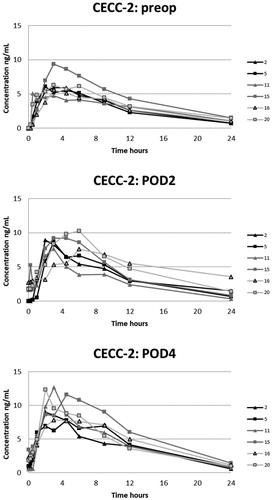
Figure 4. Plasma concentrations of oxycodone in the OPCAB-group with blood samples in the preoperative, and 1st and 3rd postoperative days.
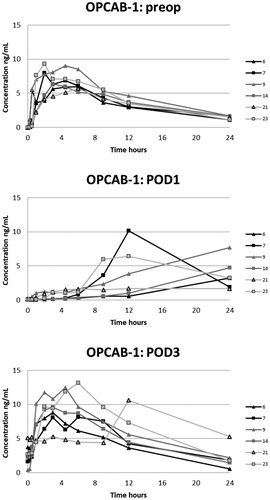
Figure 5. Plasma concentrations of oxycodone in the OPCAB-group with blood samples in the preoperative, and 2nd and 4th postoperative days.
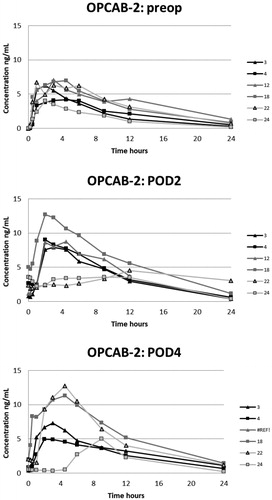
Table 2. Pharmacokinetic parameters for 10 mg oxycodone hydrochloride (9.0 mg free base) after coronary artery by-pass surgery in the different treatment groups.
Table 3. Peak concentrations of main oxycodone metabolites in plasma.
Figure 6. Predicted-corrected visual predictive check (PC-VPC) for the final oxycodone PK model. Plots show median (solid) and 90% intervals (dashed lines). The y axis is presented on a logarithmic scale. Left hand plot shows all prediction corrected observed oxycodone concentrations. Right hand plot shows prediction corrected percentiles (10%, 50%, and 90%) for observations (grey dashed lines) and predictions (red dashed lines) with 95% confidence intervals for prediction percentiles (median, pink shading; 5th and 95th blue shading).
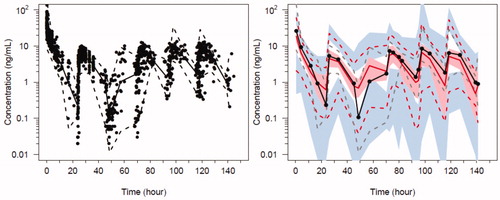
Table 4. Oxycodone population pharmacokinetic parameter estimates.
Figure 7. Pain scores in the two groups at rest (A) and with cough (B) in the two groups. Data are presented as the mean and standard deviation.
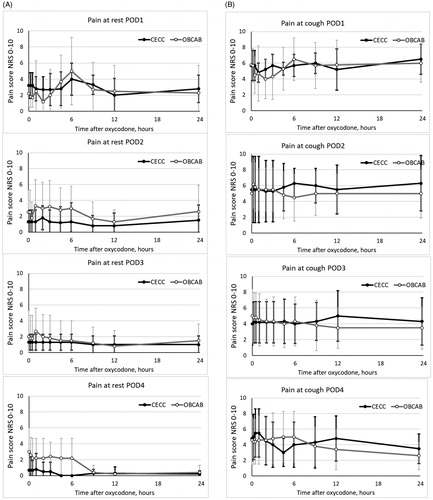
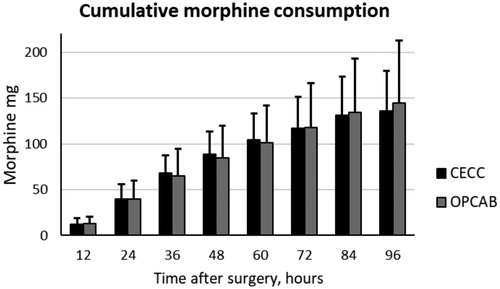
Figure 8. Morphine consumption via IV PCA pump in the two groups. Data are presented as the mean and standard deviation.
Data availability statement
The data that support the findings of this study are available from the corresponding author, HK, upon reasonable request.