
Figures & data
Table 1. Demographic and clinical characteristics of eligible study population (N = 1311).
Table 2. Performance status (PS) periods observed in the data.
Figure 1. Health care resource utilization by performance status (PS) periods for patients with colorectal, lung or gastric cancer.
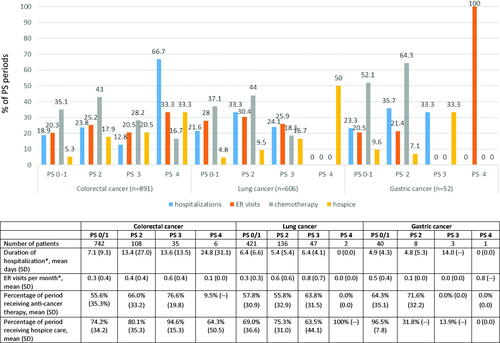
Table 3. Descriptive health care resource utilization results by cancer site and Eastern Cooperative Oncology Group (ECOG) across performance status (PS) score periods.
Table 4. Partial Spearman correlations of performance status (PS) period with health care resource utilizationa.
Supplemental Material
Download MS Word (24.9 KB)Data availability statement
The data that support the findings of this study were obtained from Truven Health Analytics (now part of IBM Watson Health). Restrictions apply to the availability of these data, which were used under license for this study.