
Figures & data
Table 1. Baseline characteristics of Q-OCRE cohort compared with OPERA I/II.
Table 2. Comorbidities in our patients treated with ocrelizumab (n = 37/60).
Table 3. Clinical and MRI outcomes in our Q-OCRE cohort.
Table 4. Safety data in Q-OCRE cohort vs. pooled OPERA I/II.
Figure 1. Kaplan–Meier survival curves showing the proportions of patients with multiple sclerosis started on Ocrelizumab remaining with no evidence of disease activity (NEDA) over follow-up time. NEDA: no evidence of disease activity.
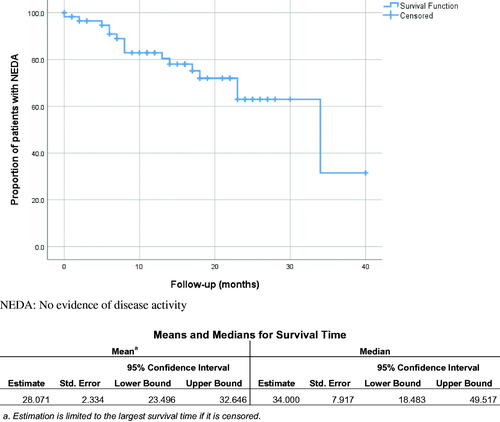
Table 5. Cox regression model with the estimated hazard ratios of having evidence of disease activity on Ocrelizumab for different covariates.