
Figures & data
Figure 1. Flow chart for literature review of studies to be included in the meta-analysis.
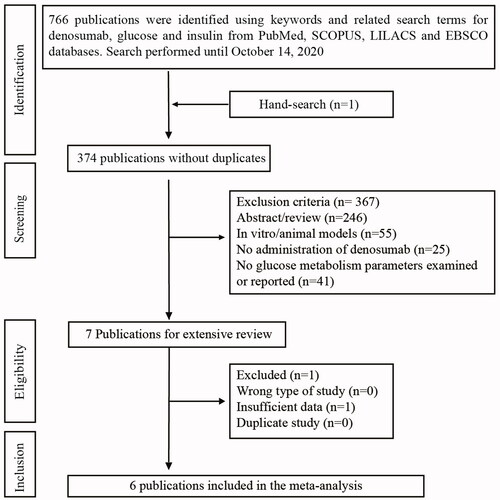
Table 1. Characteristics of the includes studies.
Table 2. Data used for analyses.
Table 3. The effect of denosumab treatment on glucose metabolism, stratified by glucose tolerance.
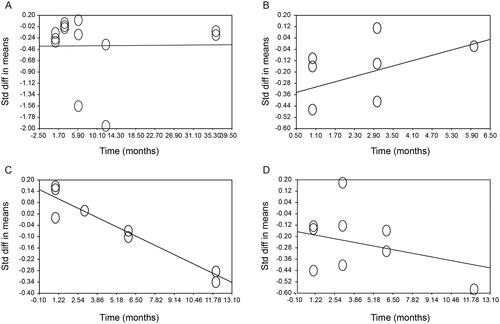
Figure 2. Time dependent effect of Denosumab treatment with respect to (A) Fasting plasma Glucose, (B) Fasting Plasma Insulin, (C) HbA1c, and (D) HOMA1-IR. The analysis was made with linear meta-regression using the method of moments by the comprehensive meta-analysis software V2. There was only a strong association between denosumab treatment and HbA1c (slope = −0.037, 95%CI: −0.059 to −0.015, p < .005).
Supplemental Material
Download PDF (2.6 MB)Data availability statement
All data generated or analyzed during this study are included in this published article and its supplementary information files.