Figures & data
Figure 1. Women gubernatorial candidates on the ballot by Party: 1978–2022, four-year election groups.
Women gubernatorial candidates have grown since the late 1970s. The largest periods of growth were the early 1990s and since 2016.
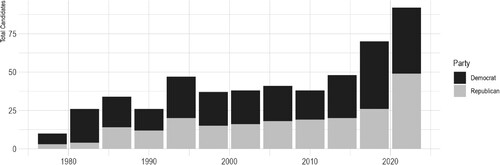
Figure 2. Women gubernatorial nominees by Party, 1978–2022, four-year election groups.
Women gubernatorial nominees grew steadily from the late 1970s, through 2006. There was then a period of decline until the 2019-2022 period.
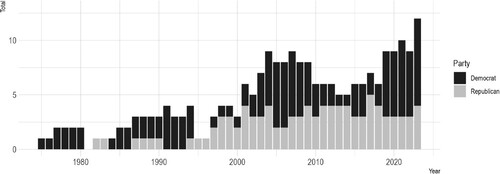
Figure 3. Women governors serving each year, 1975–2023.
The first independently elected governor was in 1978. Until 2000, there were at most 4 women governors at any one time. Women governors rose to a peak of 9 in the 2000s before declining in the 2010s. The numbers have risen in recent years and peaked in 2023 with 12 women governors.
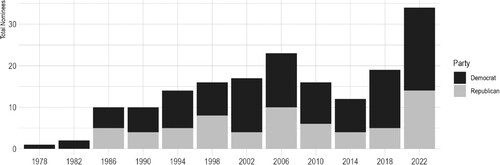
Figure 4. Number of women candidates per state over time, 1978–2022.
This map shows women gubernatorial candidates by state over time. In the 1970s and 1980s, women ran for governor in most states rarely. By 2022 almost all states have had at least one woman run for governor.
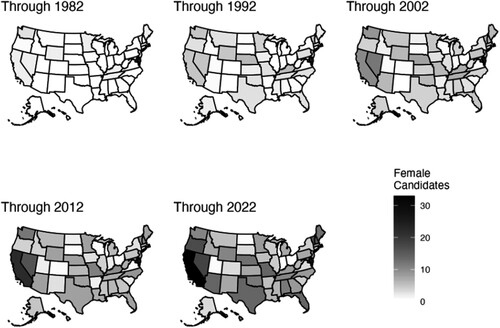
Table 1. Adjusted women candidates.
Table 2. Negative binomial models of adjusted number of women gubernatorial candidates.
Figure 5. Total women elected officials in the pipeline by Party, 1978–2022.
This graph includes box plots that track the growth of women holding elective offices, which form a potential pipeline for women gubernatorial candidates. Both the Republican and Democratic party pipelines have grown, but the size of the Democratic pipeline was and is much bigger.
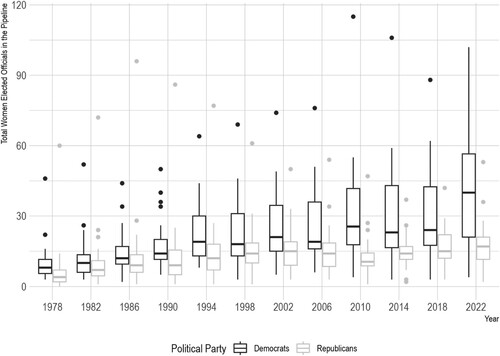
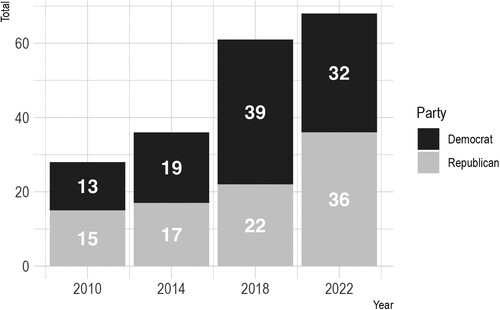
Figure 6. Women gubernatorial candidates on the ballot by Party: 2010–2022, Major Election Years.
This bar graph shows the growth of women candidates in recent major gubernatorial election years. There was a significant surge in Democratic candidates from 2014 to 2018, growing from 19 to 39. For Republicans, there was significant growth from 2018 (22 candidates) to 2022 (36 candidates).