
Figures & data
Table 1. Unemployment among graduates in the labour force six months after graduation, by study programme 1995–2015. Per cent.
Figure 1. Unemployment among master graduates in the labour force six months after graduation 1995–2015. Per cent.
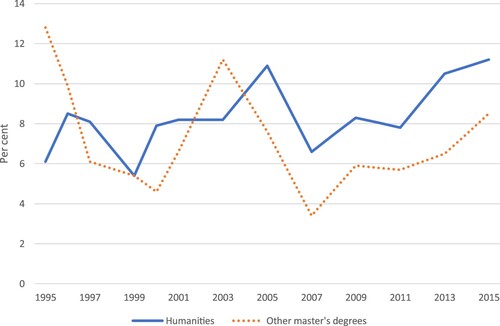
Figure 2. Over-education among employed graduates 1995–2015. Per cent.
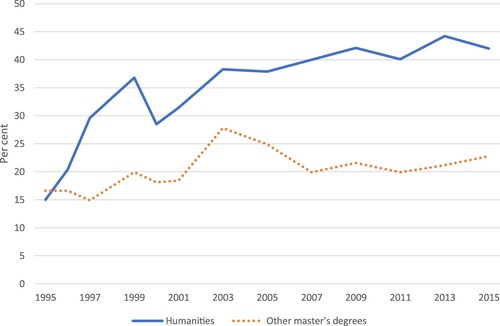
Table 2. Over-education among employed graduates six months after graduation, 1995–2015. Per cent.
Table 3. Logistic regression of the probability of unemployment for graduates in labour force. 2003–2015.a,b
Table 4. Logistic regression of the probability of overeducation for graduates in labour force. 2003–2015.a,b
Figure 3. Estimated probabilities for unemployment and over-education 2015, six months after graduation for specific categories of graduates.
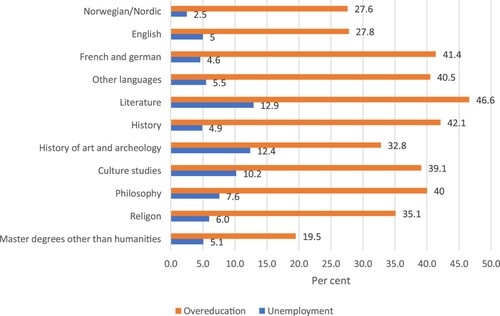
Figure A1. Number of graduates, in total and for humanities. 1995–2015.
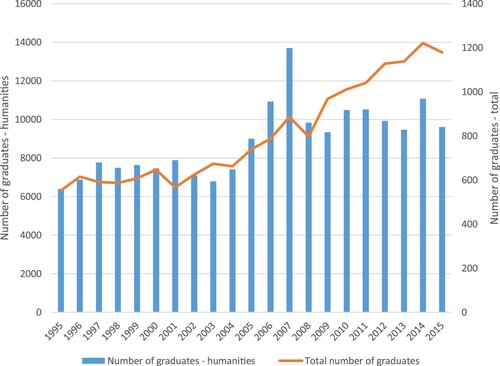
Table A1. Graduates’ background 1995–2015. Per cent.