Figures & data
FIGURE 1 Resilience-state model for a railway system. Section I: rail sector boundaries putting pressure on the OS. Section II: Rail sector boundaries with resilience slope αP causing pressure dP. Section III: OS move caused by internal change, a or b, influencing system resilience.
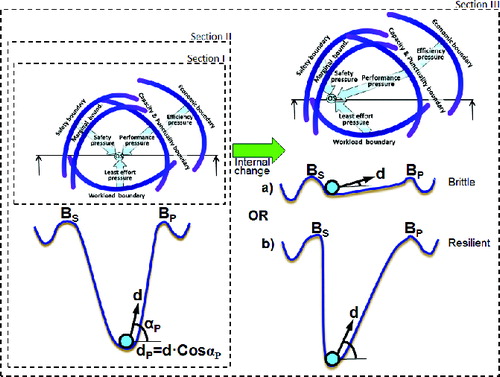
FIGURE 2 Task flow of a rail signaler at his/her workstation.
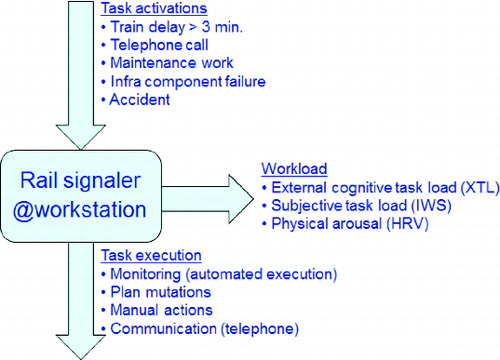
FIGURE 3 IWS application screenshot translated from Dutch (upper right red rectangle blinked to draw attention).
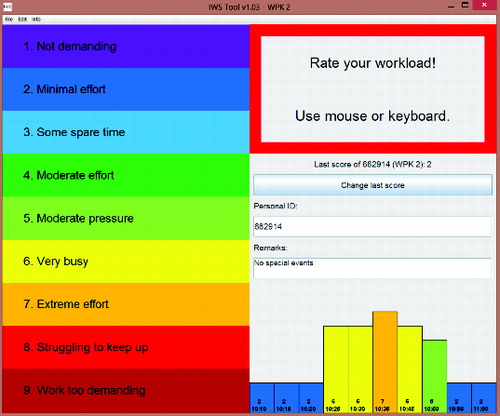
FIGURE 4 Defining objective and subjective stretch from XTL and IWS over time.
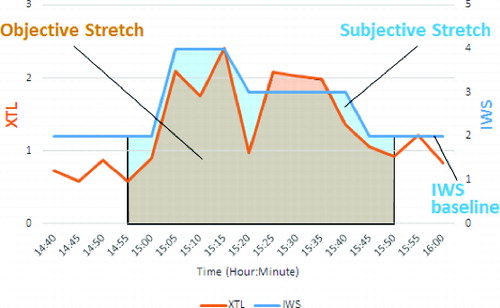
FIGURE 5 Rail control post setting with observer O.
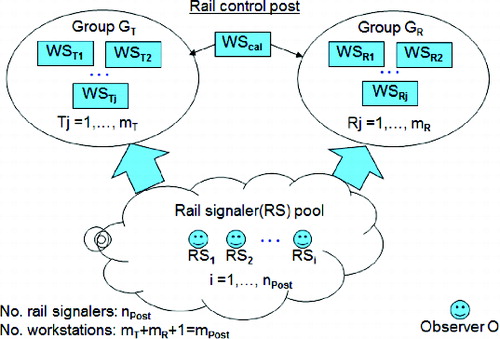
FIGURE 6 Integration of IWS tool within operations.
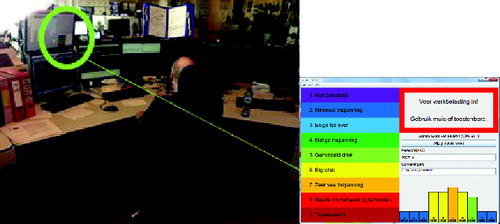
TABLE 1 Stretch measurements over one week, both before and during reorganization (cells that are not relevant for the line of argumentation are not filled in)
FIGURE 7 Objective versus subjective stretch in 1 week, both before (left) and during (right) reorganization.
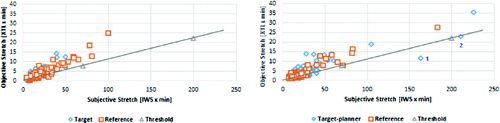
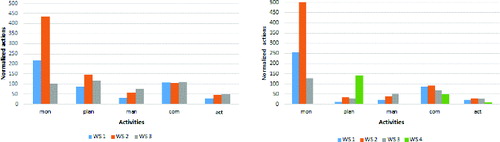
FIGURE 8 Work distribution of target group before (left) and during (right) reorganization (mon = monitoring, plan = plan mutation, man = manual action, com = communication, act = activations).