Figures & data
Figure 1. Comparison of research on green growth, innovation, and policy.
Note: The blue bars show the number of articles focused on any country, while the orange bars show the articles with a Global South country focus. ‘Narrow’, ‘weak’, and ‘strong’ are the interpretations of the Porter Hypothesis. ‘Green IP’ is Green Industrial Policy; ‘PH/Innovation’ means Porter Hypothesis and innovation effects; ‘PH/Renewables’ means Porter Hypothesis and renewable energy.
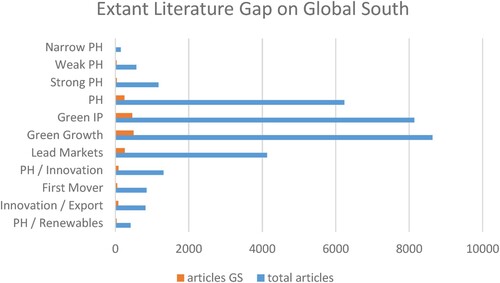
Table 1. Corpus 1 and Corpus 2 (developing countries) literature data.
Figure 2. Corpus 2 Developing countries co-citation analysis.
Note: The articles displayed are from the co-citation analysis with developing country research focus (Corpus 2). Minimum 10 citations per article threshold. Lewis (Citation2007), Binz et al. (Citation2017), and Huber (Citation2008) demonstrate the greatest centrality in the network.
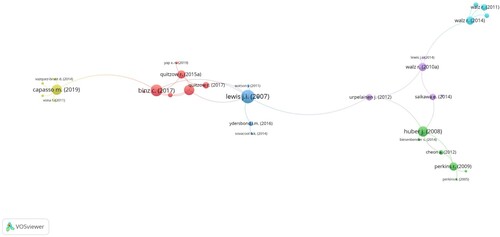
Figure 3. Corpus 2 Developing countries bibliographic coupling, clustering display.
Note: The articles displayed are from the bibliographic coupling analysis with developing country research focus (Corpus 2). Minimum 10 citations per article threshold, link analysis.
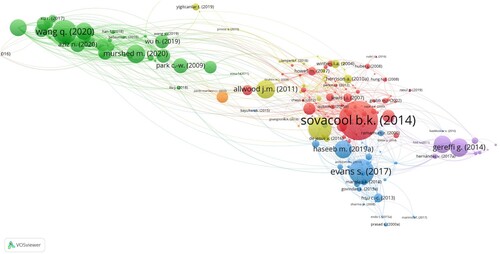
Figure 4. Corpus 2 Developing countries bibliographic coupling, overlay (yearly) display.
Note: This image mirrors , but shows the temporal trends (prior to 2010 is blue, 2010/2015 teal and 2019/2020 yellow).
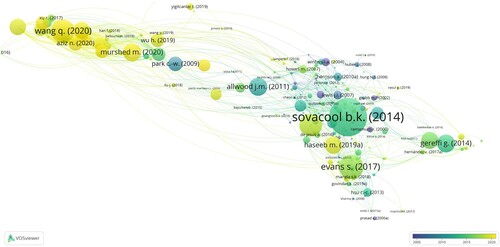
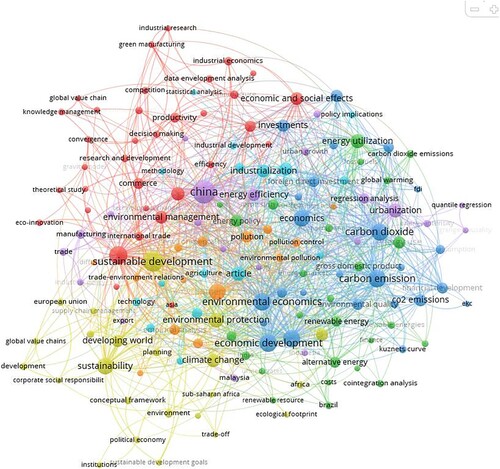
Figure 5. Automated keyword analysis across Corpus 2.
Note: Automated keyword analysis the developing country Corpus 2.