Figures & data
Table 1. Large firm by manufacturing sub-sector, 2017 (StatsSA Citation2020).
Table 2. Computer equipment and computer software as a percentage of total Gross Fixed Capital Formation (Source: Quantec).
Figure 1. Processed maize consumption trends, 1989-2019. (Source: South African Grain Information Service).
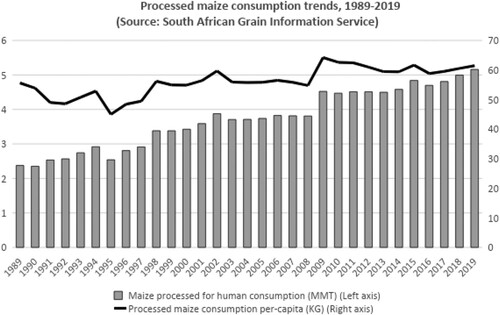
Table 3. Changes in maize-meal output, 1996/97-2018/19 (Source: SAGIS).
Table 4. Perceptions of competition among SME millers (n = 28).
Table 5. Typology of SME milling firm responses to transformation pressures (n = 28).
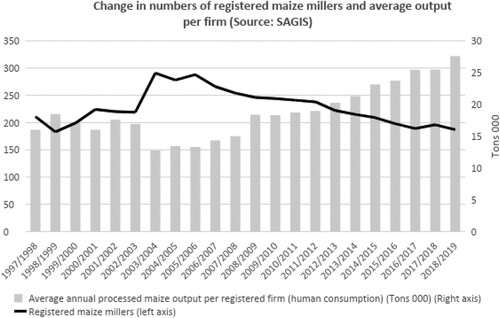
Figure 2. Change in numbers of registered maize millers and average output per firm. (Source: SAGIS).