
Figures & data
Figure 1. Localization of study site in the Eastern Region of Cameroon.
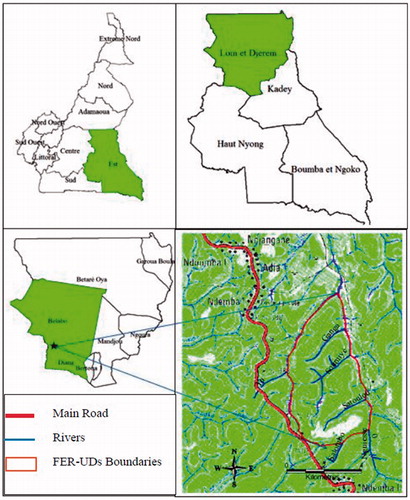
Figure 2. Flow-diagram representing different steps of land use/land cover change analysis.
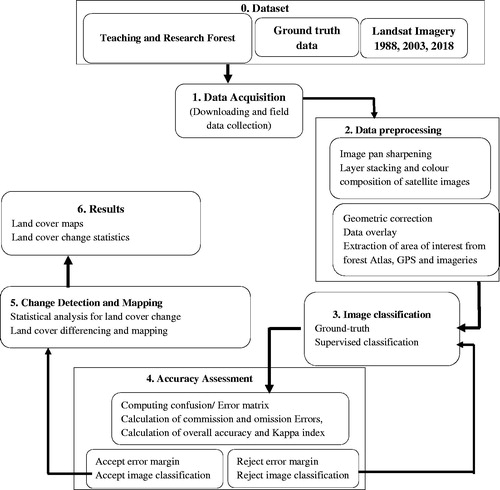
Figure 3. Localization of transects.
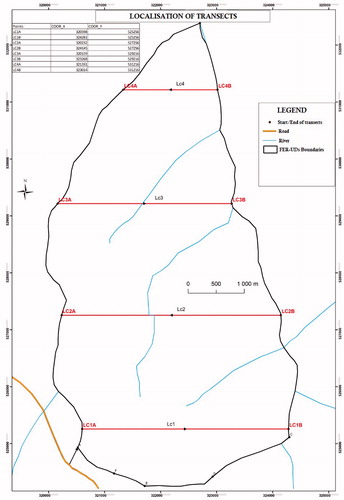
Figure 4. Dynamic of land-cover of FER-UDs from 1984 to 2016.
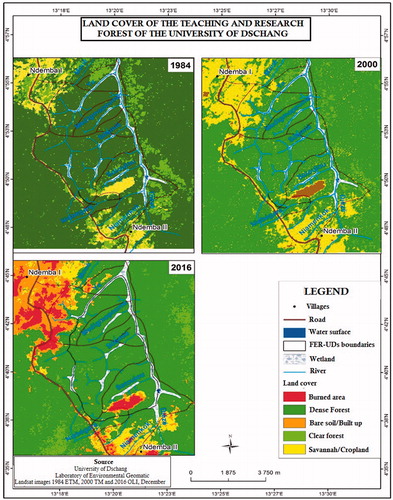
Table 1. Surface area (ha) and proportions (%) of land cover types in FER- UDs in 1984, 2000 and 2016.
Table 2. Values of overall accuracies and Kappa index.
Figure 5. Mapping of activities carried out within FER-UDs.
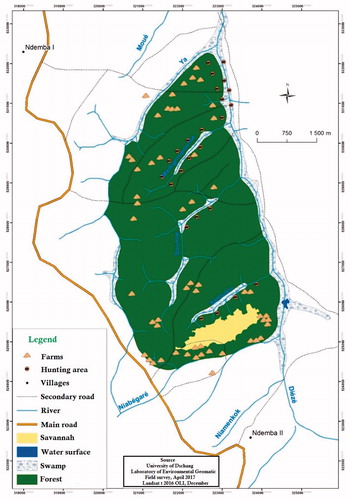
Table 3. Basal area and trees density in different land-uses types.
Figure 6. Proportions of the different types of land-use.
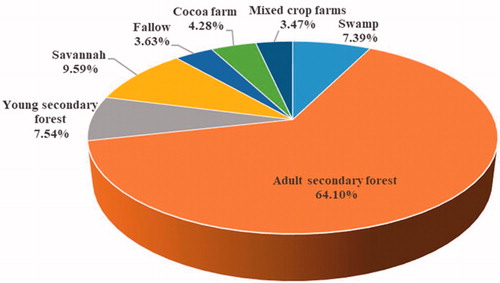
Table 4. Carbon stocks and amount of CO2 absorbed in different land-uses types.