Figures & data
Figure 1. Changes in the contribution of various litterfall components to total litterfall production during the study period. (●: Reproductive organs; ^: Leaf; □: Branches).
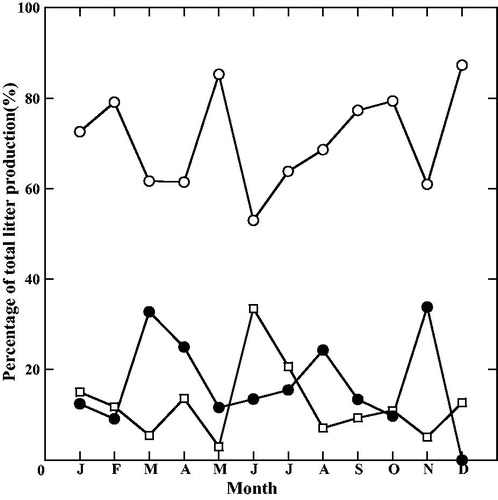
Table 1. Annual amount of vegetative and reproductive litterfall of Sundarbans mangrove forests.
Figure 2. Mangrove litterfall decomposition (expressed as the percentage of original weight remaining through time) at forest floor and burial conditions. (a) Forest floor and (b) under burial in the study area. (●: Dhangmari; ^: Ghagramari; □: Karamjol).
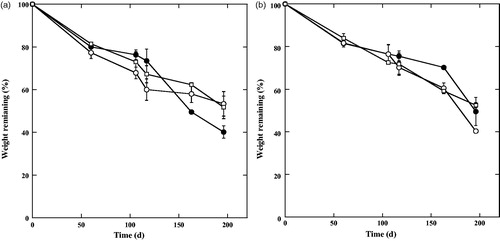
Table 2. Summary of ANOVA for weight remaining, C%, N%, and C:N ratio in litterfall after 196 d of decomposition, comparing differences between location (Dhangmari, Ghagramari, and Karamjol) and litter bag positions (forest floor and burial condition).
Figure 3. Carbon and nitrogen content, and C:N ratio of litterfall during 196 days of decomposition. (a) Carbon content at forest floor. (b) Carbon content under burial. (c) Nitrogen content at forest floor. (d) Nitrogen content under burial. (e) C:N ratio at forest floor. f) C:N ratio under burial. (Symbol same as Figure 2).
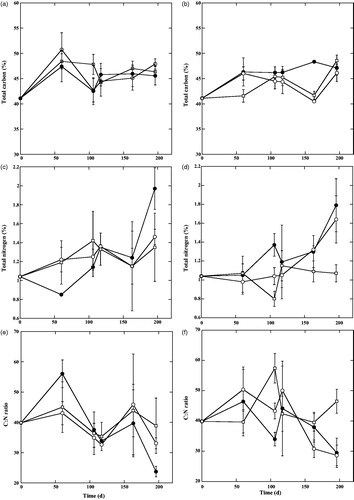
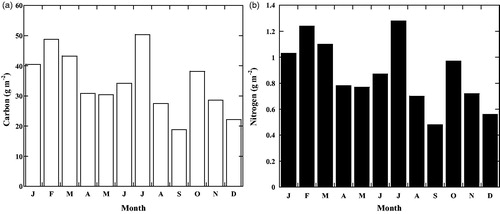
Figure 4. Accumulation of carbon and nitrogen in the Sundarbans mangrove forests during the study period.