Figures & data
Figure 1. Spatial distribution of Magnolia kobus individuals by diameter at breast height (DBH) classes in the study sites.
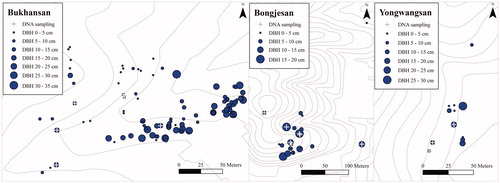
Figure 2. Inflorescence formation and fructification of M. kobus were confirmed in all the survey sites. A M. kobus individual in Bukhansan (a), a flower in Bonjesan (b), and a follicle in Yongwangsan (c).
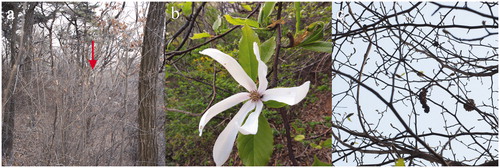
Figure 3. Outer three sepaloid tepals and small leaves under the flower were confirmed in the case of M. kobus flower (a). M. denudata flower was composed of nine tepals with similar size but there was no leaf (b).
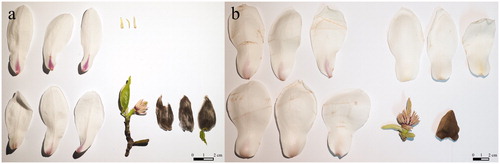
Figure 4. A phylogenetic tree was prepared using the neighbor-joining method. The genetic distances were computed using the Kimura 2-parameter model and bootstrapped with 1000 replicates.
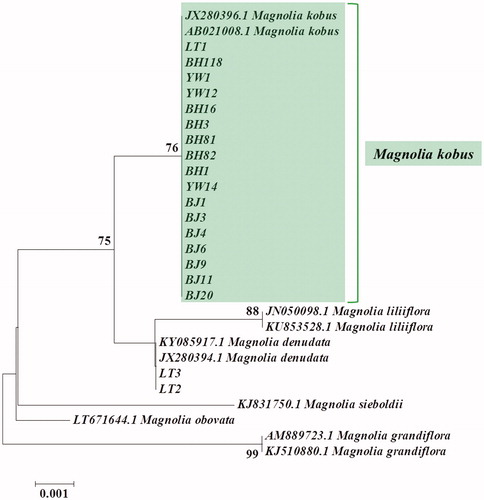
Table 1. Single-nucleotide polymorphisms in the matK region of chloroplast DNA of six Magnolia species.
Table 2. Estimates of genetic divergence between Magnolia species.
Figure 5. Diameter distribution of M. kobus individuals at the study sites.
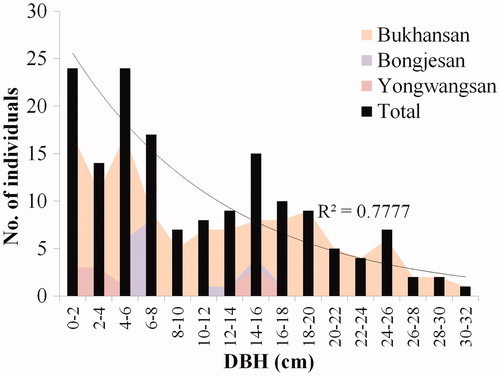
Table 3. Regression analysis of the number of individuals of Magnolia kobus by DBH.
Figure 6. Relationship between DBH and age of M. kobus individuals. Power regression model is the most appropriate.
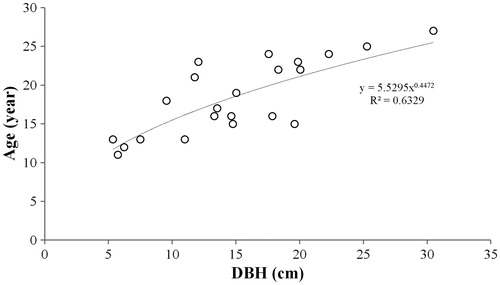
Figure 7. Estimation of age distribution of the individuals using the regression equation. The saplings shorter breast height were included in the class “less than 10 cm”.
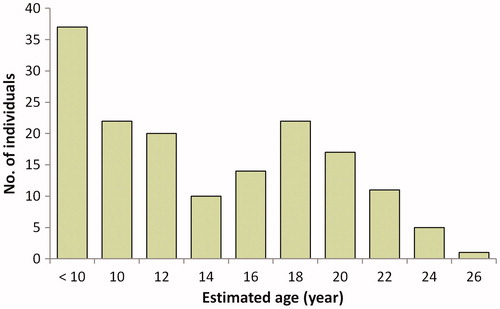
Figure 8. Box-plot with a maximum of 1.5 times of the interquartile range (IQR), representing DBH distribution of plants in which inflorescence formation or fructification was confirmed, or was not confirmed. Solid line and cross sign within the box indicate the median and the mean value, respectively. Open circle represents outliers. NR: non-reproductive; RE: reproductive.
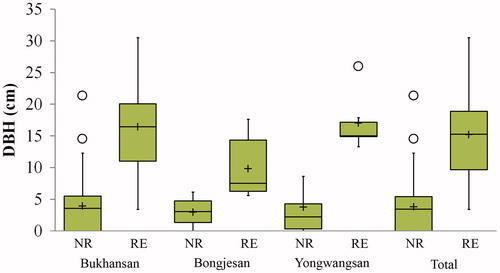
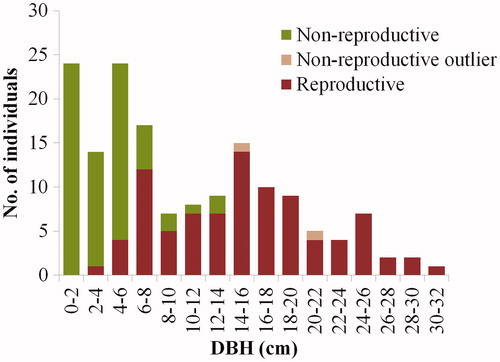
Figure 9. Proportion of reproductive individuals in each DBH class.