Figures & data
Figure 1. The rainfall distribution over the years 2011 to 2012.
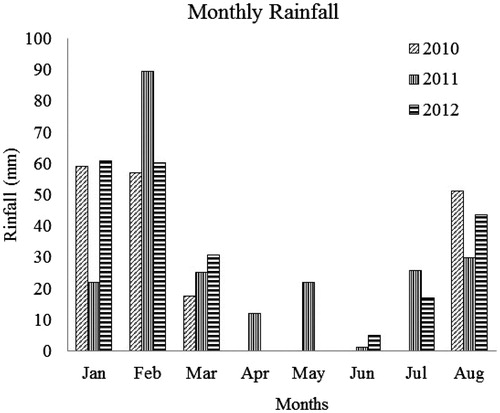
Table 1. The physical and chemical soil properties for the experimental area.
Table 2. Runoff volume (L) generated by PAM-treated, plastic mulch and natural plots.
Figure 2. Schematic diagram representing the field experimental layout of PAM treatments and land covers as well as the Acacia saligna trees.
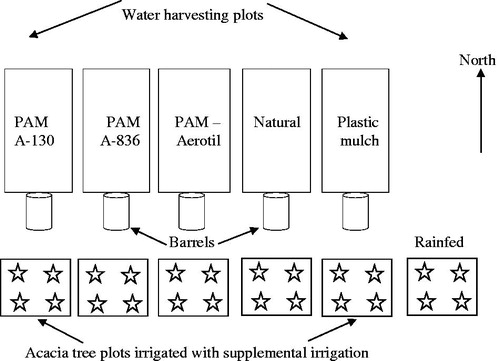
Figure 3. Runoff coefficients for PAM-treated plots compared to natural plots (no PAM no plastic mulch).
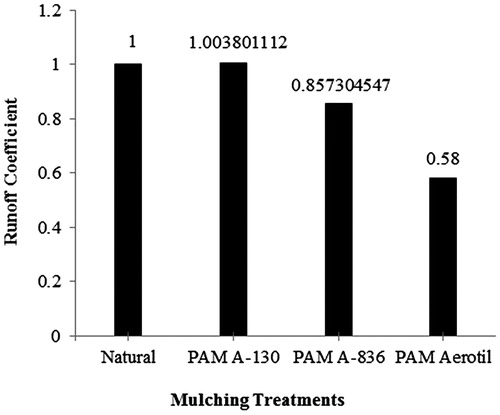
Figure 4. The number of acacia leaves under different treatments.
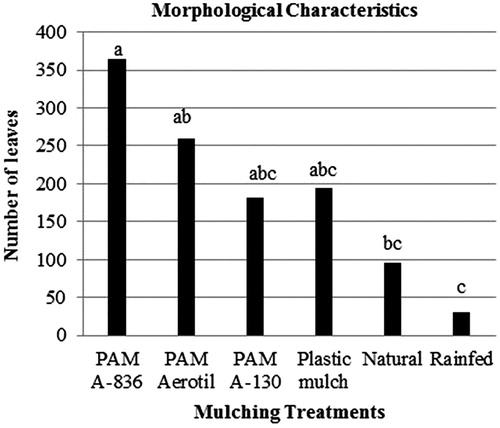
Figure 5. The plant height (cm) under different treatments.
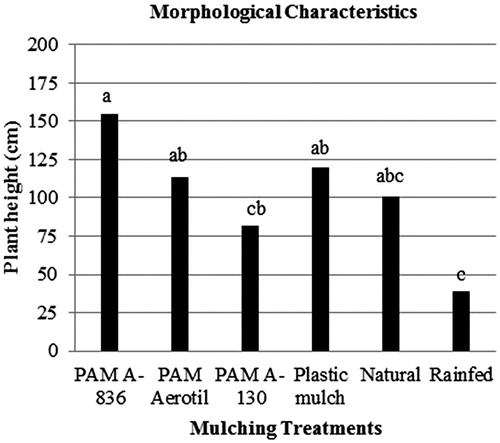
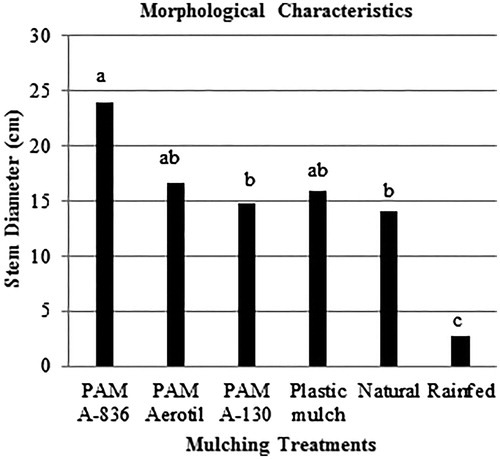
Figure 6. The stem diameter (cm) under different treatments.