Figures & data
Figure 1. Map location of Lun soum in Mongolia, photograph of study site, and an example of the plantation design used in the study plots. The Populus sibirica and Ulmus pumila were planted in alternating lines. The distance between rows and the planting distance between trees were 4 m and 2 m, respectively.
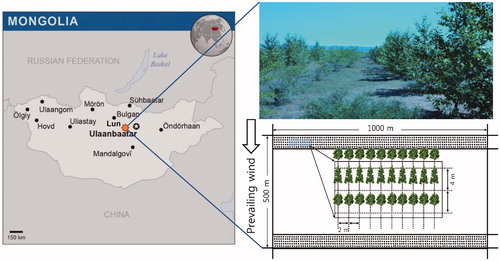
Table 1. Tree heights and root collar diameters of sampled Populus sibirica and Ulmus pumila grown under different irrigation regimes.
Figure 2. Daily average environmental variables in Lun soum plantation (a) Average daily mean temperature (Ta, °C), (b) vapor pressure deficit (D, kPa), (c) photosynthetically active radiation (Q, μmol m−1 S−1), (d) precipitation (mm), and (e) soil volumetric water content (θ, %) measured at the study site between July and September 2014. (□) Control, (•) Populus sibirica, (○) Ulmus pumila; (|), blue vertical line, represents irrigation treatment.
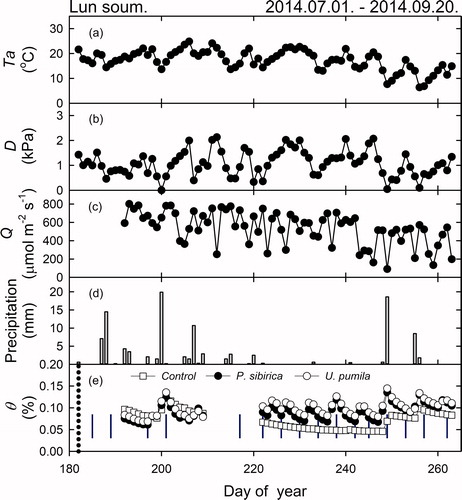
Figure 3. Comparisons of average leaf size (cm2) and specific leaf area (SLA, cm2 g−1) of Populus sibirica and Ulmus pumila. (a) Interspecies comparison of leaf size (p < 0.001), (b) interspecies comparison of SLA (p < 0.001), (c) seasonal changes in the SLA of P. sibirica (p < 0.001), and (d) seasonal changes in the SLA of U. pumila (p < 0.01). Contained within each box are the lower quartile, median (dash), mean (short dash), and upper quartile of the values. Different letters on the error bars indicate significant differences according to the t-test and Tukey’s multiple range test at p < 0.05.
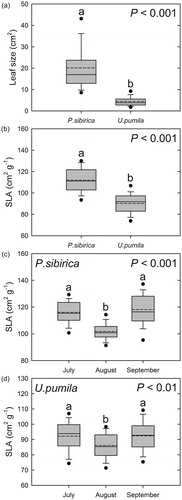
Figure 4. Comparisons of photosynthetic characteristics between Populus sibirica and Ulmus pumila. (a) Seasonal differences in the maximum rates of photosynthesis (Amax, μmol m−2 s−1) of P. sibirica and U. pumila (p < 0.01), (b) seasonal differences in the maximum rate of carboxylation (VCmax, μmol m−2 s−1) of P. sibirica and U. pumila (p < 0.001), (c) comparison of the maximum rate of electron transport (Jmax, μmol m−2 s−1) of P. sibirica and U. pumila (p < 0.01), and (d) the relationship between VCmax and Jmax. Closed circles (•) and open circles (○) represent P. sibirica and U. pumila, respectively. The solid line represents the regression line (Jmax = 0.83 × VCmax + 56.27, R2 = 0.74, p < 0.001). Different letters on the error bars indicate significant differences according to t-test and Tukey’s multiple range tests at p < 0.05. The differences in the regression were calculated using analysis of covariance (ANCOVA).
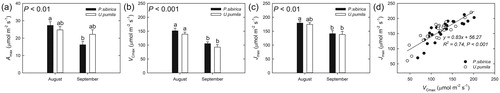
Figure 5. Comparisons of the intrinsic water use efficiency (WUEi), stomatal conductance (gs), and maximum photosynthetic capacity (Amax) between Populus sibirica and Ulmus pumila. (a) The relationship between gs (mol m−2 s−1) and WUEi (mmol mol−1) in P. sibirica and U. pumila. The curve is a non-linear regression line fit to all data. (b) The relationship between Amax (μmol m−2 s−1) and WUEi in P. sibirica and U. pumila. The dashed lines are linear regression through the data points for the two individual species. Closed circles (•) and open circles (○) represent P. sibirica and U. pumila, respectively.
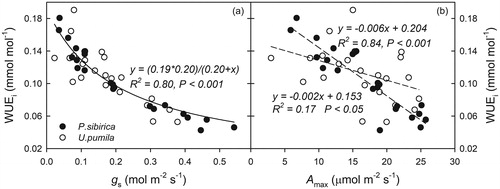
Figure 6. Comparisons of the carbon isotope discrimination (Δ13C) and WUEi between Populus sibirica and Ulmus pumila. (a) Values of Δ13C (‰, mean ± SE) calculated from carbon isotope composition (δ13C) for P. sibirica and U. pumila. (b) Mean values of Δ13C over the 2 months, respectively. Different lowercase letters above the error bars indicate significant differences at p < 0.05. (c) Relationships between Δ13C and intrinsic water use efficiency (WUEi, mmol mol−1) for P. sibirica and U. pumila. The solid line represents the linear regression through the data points for both species.
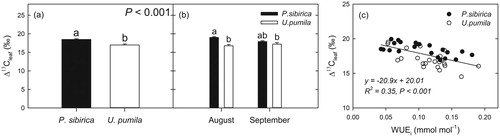
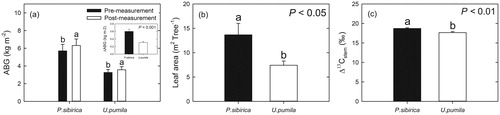
Figure 7. (a) Mean values of aboveground biomass (ABG, kg m−2) for Populus sibirica and Ulmus pumila. The inset presents the changes in ABG between pre-measurement and post-measurement. (b) Leaf area (m2 tree−1) of P. sibirica and U. pumila. (c) The values of stem carbon isotope discrimination (‰, Δ13C, mean ± SE) calculated from the carbon isotope compositions (δ13C) of P. sibirica and U. pumila. Different lowercase letters above the error bars indicate significant differences at p < 0.05.