
Figures & data
Figure 1. The appearance of hardy kiwifruit Actinidia arguta “Daebo” grown in Kangwon-do, Korea.
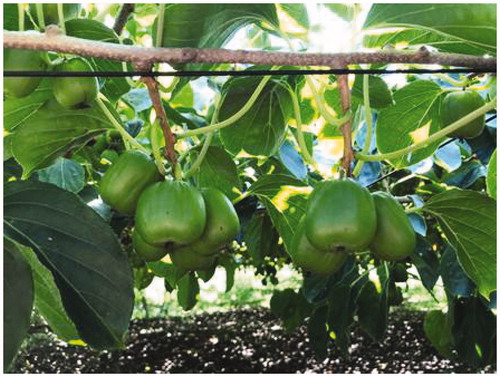
Figure 2. The gas treatment system using chlorine dioxide generator (CA-300, Purgofarm, Hwaseong, Korea) implemented for fumigation of hardy kiwifruit. (A) ClO2 gas generator; (B) gas collection chamber with controlled concentration of ClO2; (C) fumigation chamber.
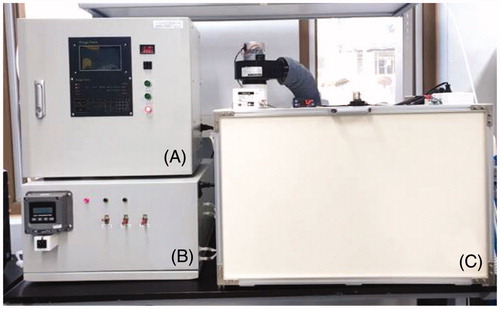
Figure 3. Quality changes in hardy kiwifruit stored at 2 °C and treated with chlorine dioxide (ClO2) and non-treated control. (A) Firmness (N); (B) Soluble solid content (%); (C) Titratable acidity (%); (D) ratio of soluble solid–acid. Vertical bars represent standard error of the means. *, ** represent significant difference according to the independent t-test at p < .05 and .01, respectively.
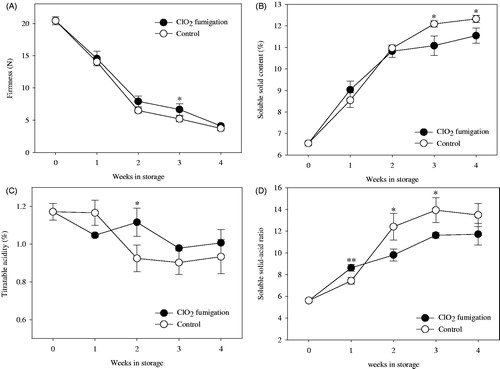
Figure 4. Effects of fumigation with chlorine dioxide gas on total phenolic content of hardy kiwifruit during storage. Vertical bars represent standard error of the means. ***represents significant difference according to the independent t-test at p < .001.
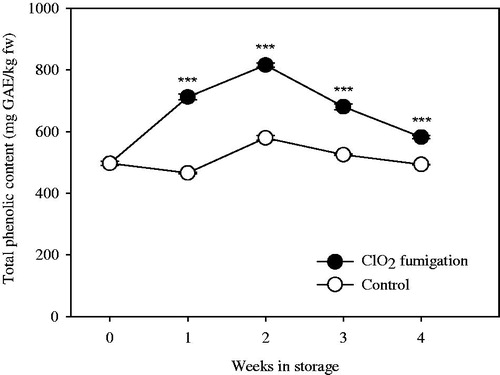
Table 1. Percentage decay and microbial populations (log colony forming units, log CFU/g) according to the ClO2 treatment in hardy kiwifruit stored at 2 °C for 5 weeks.