
Figures & data
Figure 1. Geographic location of the study sites of the Sundarbans mangrove forest, Bangladesh from which litterfall data were collected.
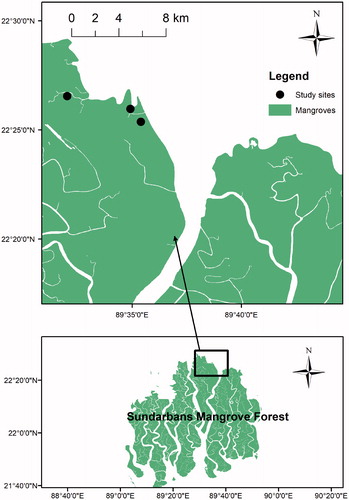
Table 1. Mean annual mass (g/sq m/yr) of vegetative and reproductive litterfall release of Heritiera fomes in the Sundarbans mangrove forest during study period.
Figure 2. Phenograms of vegetative organs (a) leaf litterfall; (b) stipule litterfall; and (c) branch litterfall for Heritiera fomes during the study period. Vertical bars represent standard error.
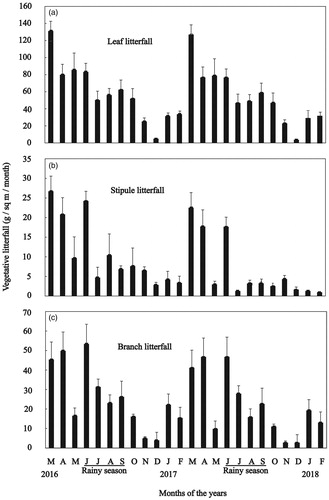
Figure 3. Phenograms of reproductive organs (a) flower litterfall; (b) immature litterfall; and (c) mature litterfall for Heritiera fomes during the study period. Vertical bars represent standard error.
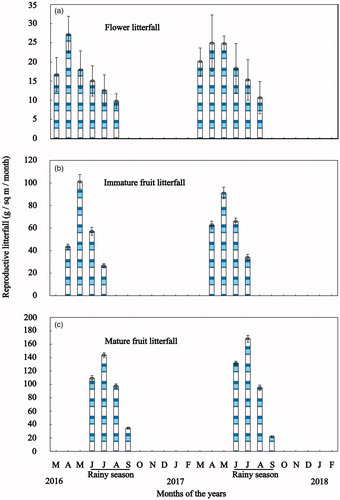
Figure 4. Phenograms of total litterfall release for (a) vegetative litterfall; (b) reproductive litterfall; and (c) total litterfall Heritiera fomes during the study period. Vertical bars represent standard error.
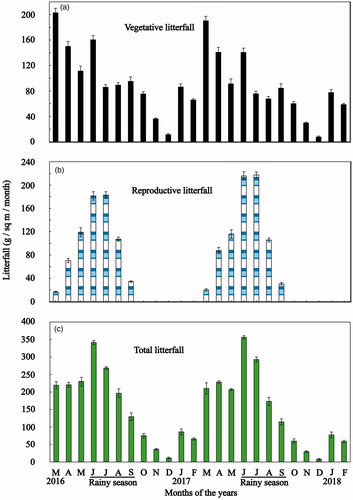
Figure 5. Principal component ordination of vegetative and reproductive litterfall release of Heritiera fomes with environmental factors. The horizontal axis of the ordination plot shows the first principal component (PC 1) with an eigenvalue of 6.84, explaining 63.1% of variance and the vertical axis shows the second principal component (PC 2) with an eigenvalue of 1.28, explaining 10.27% of variance. The dots represent the months of the study period, in which the litterfall and metrological data collected. The dots within the circle represent rainy season.
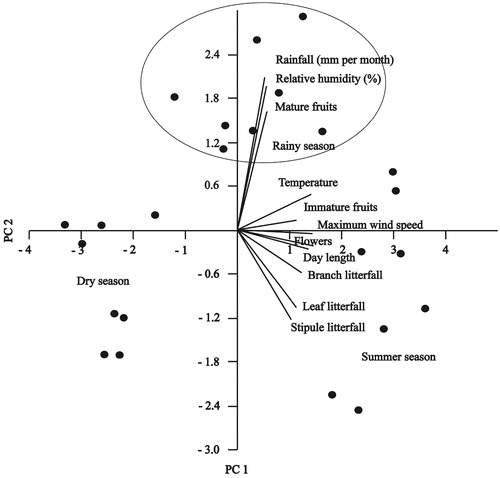
Table 2. Pearson’s correlation coefficient between litterfall release of Heritiera fomes and environmental variables.