
Figures & data
Table 1. Main data of experimental facilities.
Figure 1. Structure of small-scale simulation model set up at the 30 cm height from the ground.
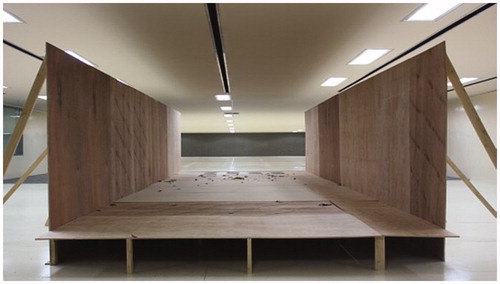
Figure 2. Wind tunnel experimental arrangement including locations of trees and measurement points.
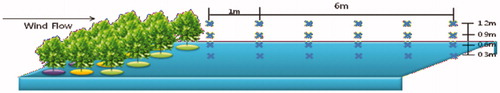
Figure 3. Spatial distributions of mean velocity by number of planting lows of Pinus thunbergii.
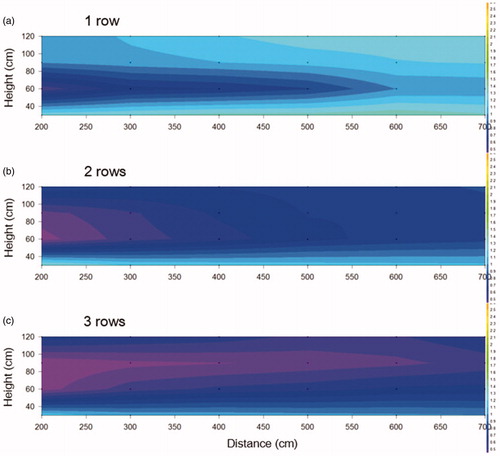
Figure 4. Spatial distributions of mean velocity by number of planting lows of Quercus acutissima.
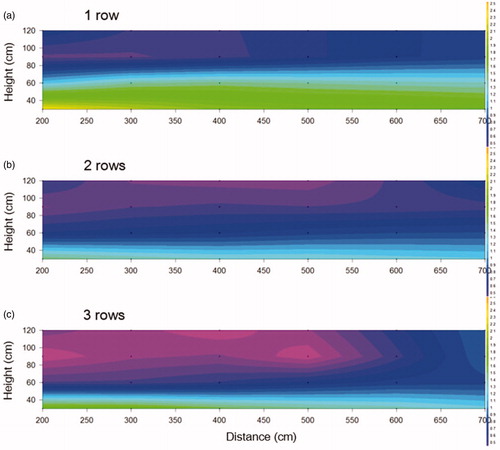
Figure 5. Spatial distributions of mean velocity by planting order.
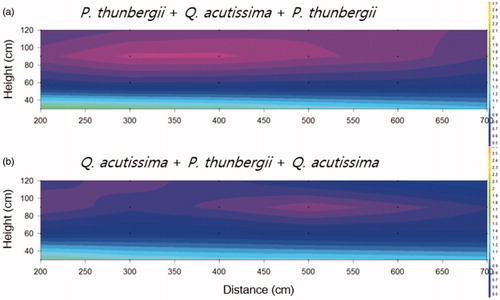
Table 2. Wind velocity and reduction ratio at each sample point for P. thunbergii.
Table 3. Wind velocity and reduction ratio at each sample point for Q. acutissima.
Table 4. Wind velocity and reduction ratio at each sample point for mixed structures of P. thunbergii and Q. acutissima.