
Figures & data
Figure 1. Map of study area, Ban Mae Chiang Rai Lum Community Forest in northern Thailand.
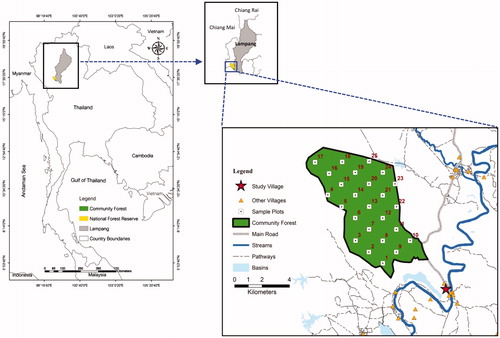
Figure 2. Conceptual framework links between utilization of NTFPs and CFM in community forest for livelihood and biodiversity conservation.
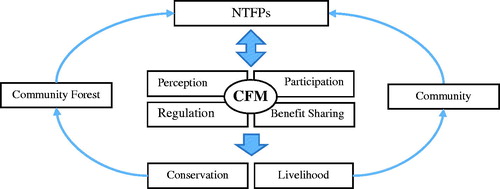
Table 1. Components CFM effectiveness.
Table 2. Variable descriptions and expected socio-economic factors’ impact on NTFP income and participation in CFM.
Table 3. Current status of plant species in the community forest.
Figure 3. Socio-economics of sampled households.
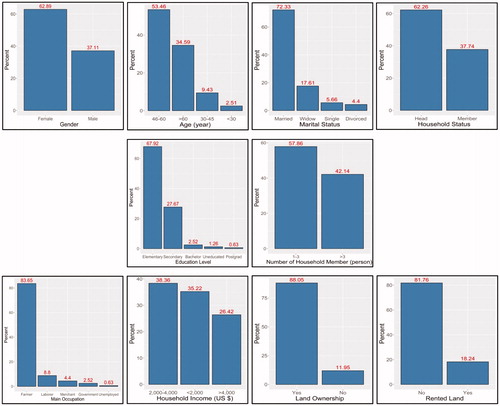
Table 4. Total net NTFP income return from Ban Mae Chiang Rai Lum Community Forest in 2018.
Table 5. Mean comparison between NTFP income and household income.
Table 6. Effectiveness of CFM and level of participation.
Table 7. Correlations (Spearman) between NTFP income and CFM (n = 159).
Table 8. Multiple linear regression for variables predicting NTFP income (n = 109).
Table 9. Multiple linear regression for variables predicting participation in CFM (n = 159).