
Figures & data
Figure 1. Cumulative heights and root diameters of Korean red pine from three different CO2 concentration treatment chambers. OTC1: Elevated CO2 level as 1.4x (approximately 560 ppm), OTC2: elevated CO2 level as 1.8x (approximately 680 ppm), and OTC3: ambient CO2 level (approximately 380 ppm).
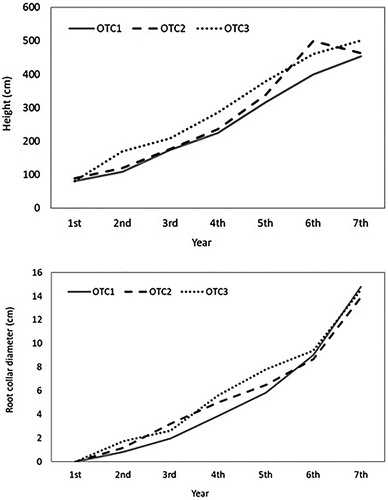
Figure 2. Rarefaction curves for bacterial operational taxonomic units (OTUs; 97% sequence similarity) in each sampling chamber associated with the rhizosphere of pine tree. In the rarefaction curves, the number of OTUs increased with the number of sequencing reads. OTC1: elevated CO2 level as 1.4x (approximately 560 ppm), OTC2: elevated CO2 level as 1.8x (approximately 680 ppm), and OTC3: ambient CO2 level (approximately 380 ppm).
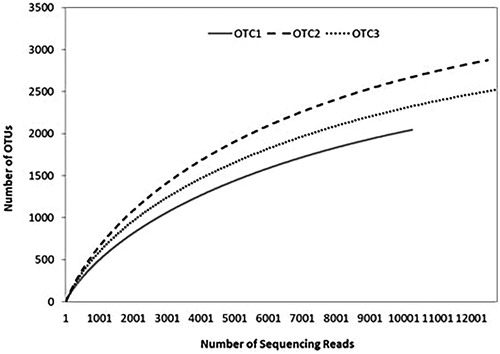
Table 1. Comparison of the estimated OTU richness and diversity indexes in the rhizosphere of Korean red pine according to CO2 concentration.
Figure 3. Similarity of phylogenetic diversity at the phylum level (97% sequence similarity) for bacterial communities. The hierarchical relationship was obtained via the unweighted pair group method with arithmetic mean (UPGMA) clustering dendrogram. OTC1: elevated CO2 level as 1.4x (approximately 560 ppm), OTC2: elevated CO2 level as 1.8x (approximately 680 ppm), and OTC3: ambient CO2 level (approximately 380 ppm).
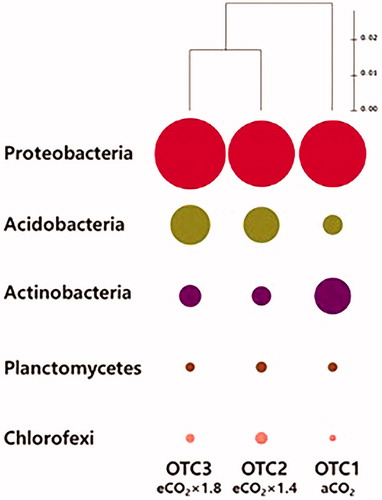
Figure 4. Relative distribution (%) of the main bacteria taxa detected in the rhizosphere of Korean red pine tree according to CO2 concentration. OTC1: elevated CO2 level as 1.4x (approximately 560 ppm), OTC2: elevated CO2 level as 1.8x (approximately 680 ppm), and OTC3: ambient CO2 level (approximately 380 ppm).
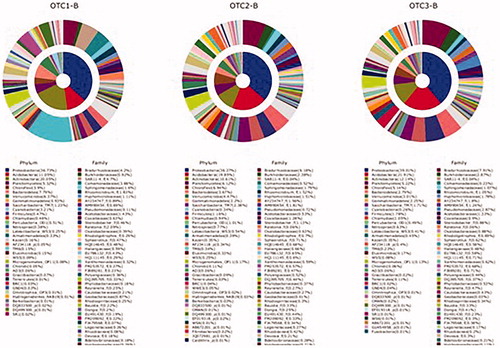
Table 2. Chemical properties of Korean red pine leaves according to CO2 concentration.
Table 3. Soil chemical properties in the rhizosphere of Korean red pine according to CO2 concentration.