Figures & data
Figure 1. Locations of the (a) Yeonyeop stream (YS) and (b) Bukhan River (BR). The river map was taken from the National Institute of Environmental Research database.
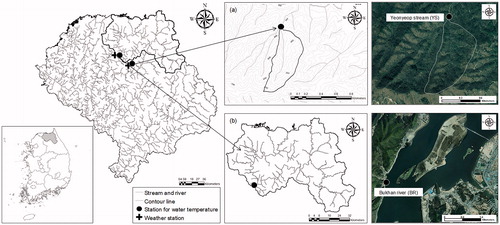
Figure 2. (a) One-day and cumulative precipitation, (b) relative humidity, (c) air temperature, and (d) water temperature in the Yeonyeop stream (YS) and Bukhan River (BR) from April to November 2017 and 2018. The dotted and shaded areas indicate values excluded due to data missing from the study sites.
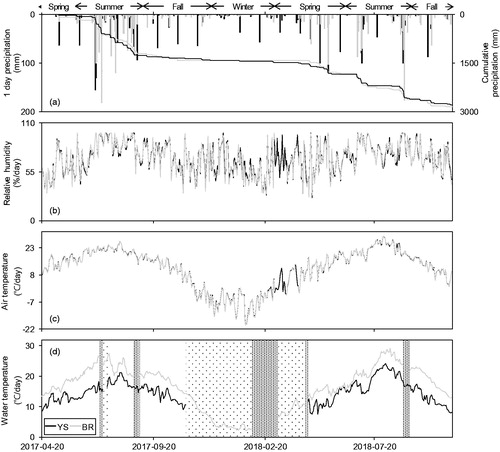
Table 1. Summary of water temperature and other climate observations.
Figure 3. Seasonal changes in (a) precipitation (PT), (b) air temperature (TA), and (c) water temperature (Tw) at the Yeonyeop stream (YS) and Bukhan River (BR) from April to November 2017 and 2018.
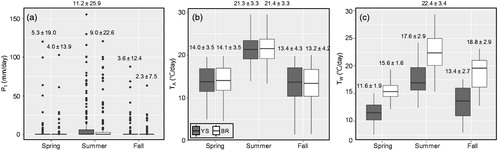
Figure 4. Elasticity distribution (εT: temperature elasticity, εP: precipitation elasticity) at the (a) Yeonyeop stream (YS) and (b) Bukhan River (BR) from April to November 2017 and 2018. The horizontal dashed lines indicate mean values of εT and εP. The dotted area indicates values that are not available (N/A) due to data missing from December to March of the study period.
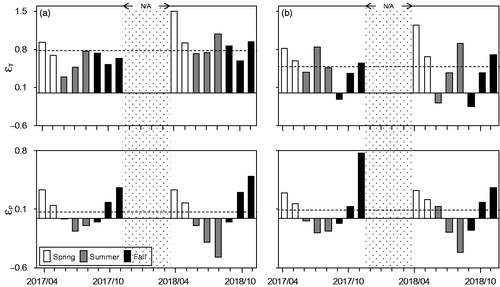
Figure 5. (a) Temperature (εT) and (b) precipitation (εP) elasticities at the Yeonyeop stream (YS) and Bukhan River (BR) from April to November 2017 and 2018. A two-sample Student’s t-test is indicated in separate bold letters (a and b) above the box.
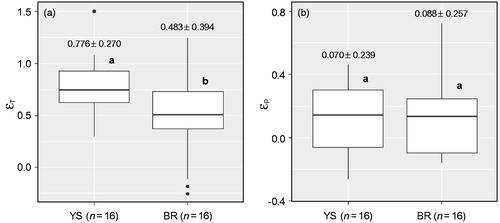
Figure 6. Seasonal changes in (a) temperature (εT) and (b) precipitation (εP) elasticities at the Yeonyeop stream (YS) and Bukhan River (BR) from April to November 2017 and 2018. Values above each box indicate mean ± standard deviation. A two-sample Student’s t-test is indicated in separate bold letters (a and b) above the box.
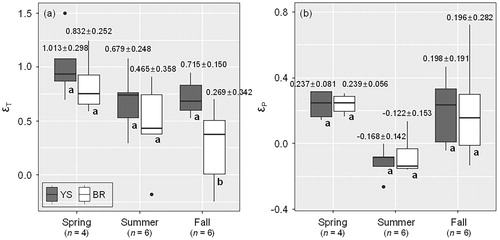
Table 2. Correlation analysis of the seasonal differences between Tw (water temperature) and both temperature (εT) and precipitation (εP) elasticities at the Yeonyeop stream (YS) and Bukhan River (BR) from April to November 2017 and 2018.
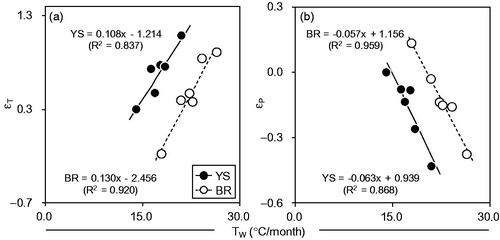
Figure 7. Relationship between water temperature (Tw) and both (a) temperature (εT) and (b) precipitation (εP) elasticities at the Yeonyeop stream (YS) and Bukhan River (BR) during the summer season from April to November 2017 and 2018.