Figures & data
Table 1. Summary of chlorophyll fluorescence parameters from OKJIP test.
Figure 1. Changes of temperature (a), relative humidity (b), vapor pressure deficit (c) and soil water contents (d) during the experimental period.
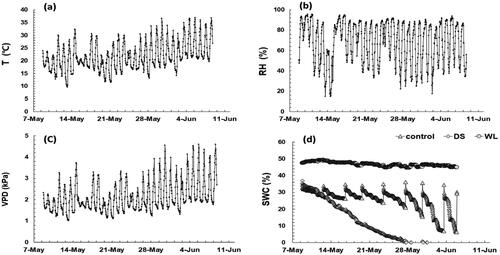
Figure 2. Changes in maximum photosynthesis rate (a), stomatal transpiration rate (b), stomatal conductance (c), instantaneous transpiration efficiency (d), intrinsic water use efficiency (e) and ratio of intercellular to atmospheric CO2 concentration (f) of Prunus yedoensis under different water conditions. Each value is expressed as the mean ± SD (n = 5). DAT: days after treatment.
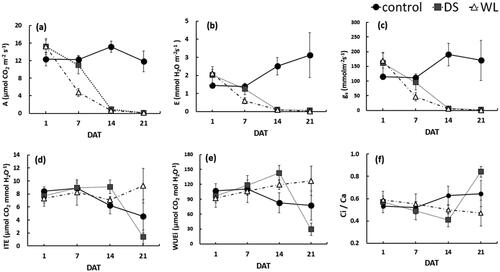
Table 2. Repeated measures ANOVA for maximum photosynthesis rate (A), stomatal transpiration rate (E), stomatal conductance (gs), instantaneous transpiration efficiency (ITE), intrinsic water use efficiency (WUEi) and ratio of intercellular to atmospheric CO2 concentration (Ci/Ca) of Prunus yedoensis under different water conditions.
Table 3. Changes in maximum carboxylation rate (Vcmax), maximum electron transport rate (Jmax) and CO2 compensation point (Γ) of Prunus yedoensis under different water conditions.
Figure 3. Changes in water saturation deficits (a), height growth (b) and root collar growth (c) of Prunus yedoensis under different water conditions. Each bar is expressed as the mean ± SD (n = 5). Means with difference letters are significantly different by DMRT Test (p < 0.05). DAT: days after treatment; ns: non-significance; n.d.: not detected.
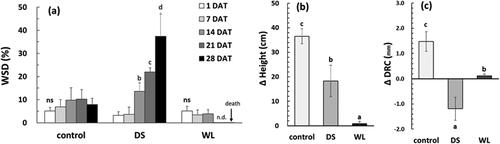
Figure 4. Visual damage of drought treatment (a–d) and waterlogging treatment (e–h) during the experimental period. DAT: days after treatment.
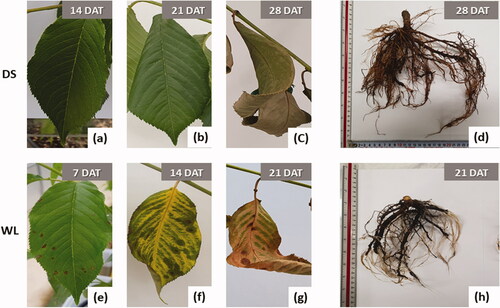
Table 4. Growth characteristics of Prunus yedoensis under different water conditions.
Table 5. Inorganic components in leaf and root of Prunus yedoensis under different water conditions.
Table 6. Changes in chlorophyll (Chl) and carotenoid (Car) contents of Prunus yedoensis under different water conditions.
Figure 5. Changes in several chlorophyll fluorescence parameters (VJ (a), VK (b), ABS/RC (c), DIo/RC (d), PIabs (e), DFabs (f), SFIabs (g) and Drought factor index (h)) of Prunus yedoensis under different water conditions. Each bar is expressed as the mean ± SD (n = 5). Means with difference letters are significantly different by DMRT Test (p < 0.05). DAT: days after treatment; ns: non-significance.
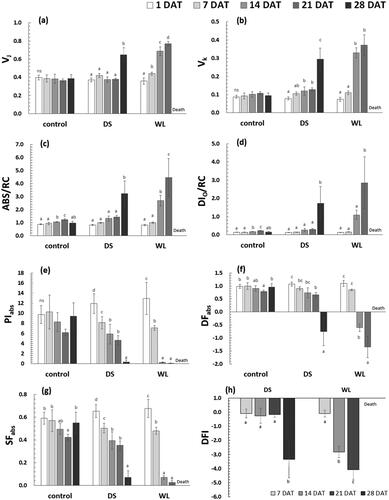
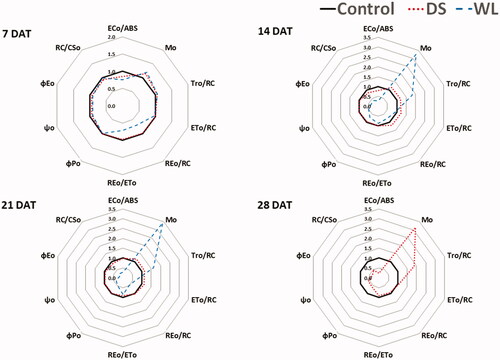
Figure 6. Radar plots of several chlorophyll fluorescence parameters (ECo/ABS, Mo, TRo/RC, ETo/RC, REo/RC, REo/ETo, ΦPO, ΦEO, ΨO and RC/CSo) of Prunus yedoensis under different water conditions. The values of the calculated parameters were shown as relative to those of the control (n = 5).