Figures & data
Figure 1. Location of study site in South Korea.
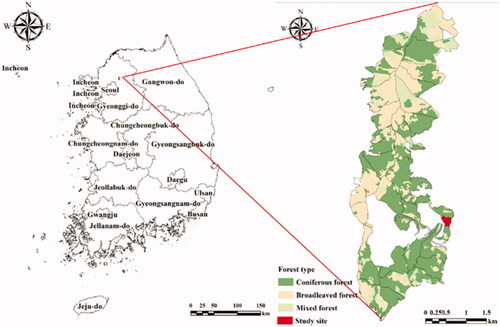
Table 1. Description of the study site.
Figure 2. Study site and thinning treatments of SST and MLT systems.
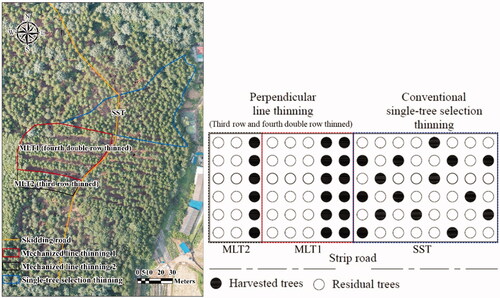
Table 2. Descriptions of SST and MLT systems.
Table 3. SST and MLT machine specifications.
Table 4. Classification of residual stand damage.
Table 5. Cost factors and assumptions used for machine cost calculation using the KWF method.
Table 6. Productivity and cost of SST and MLT systems.
Figure 3. Cost comparison between SST and MLT systems.
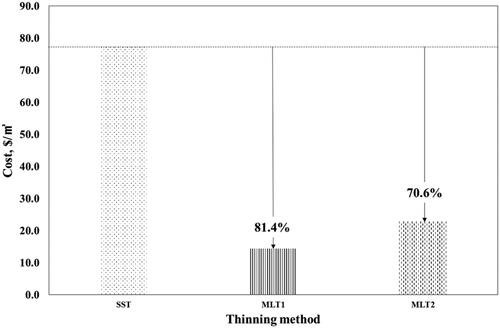
Table 7. Productivity and cost of felling and processing operations using a small-scale grapple-saw and small harvester.
Table 8. Kruskal-Wallis H test of residual stand damage between SST and MLT systems.
Table 9. Description of residual stand damage by SST and MLT systems.
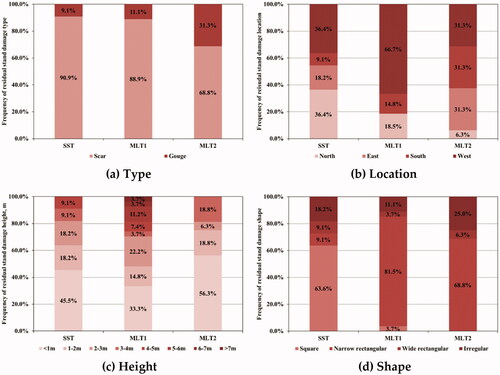
Figure 4. Percentage of total stand damages as related to (a) type, (b) location, (c) height, and (d) shape for SST and MLT systems.