
Figures & data
Figure 1. Atmospheric particulate matter (PM) and weather data during the data collection period. (a) Mean concentration of atmospheric PM, (b) Sum of PM inflow, (c) Mean ratio of PM2.5 to PM10, (d) Mean rainfall and wind speed data.
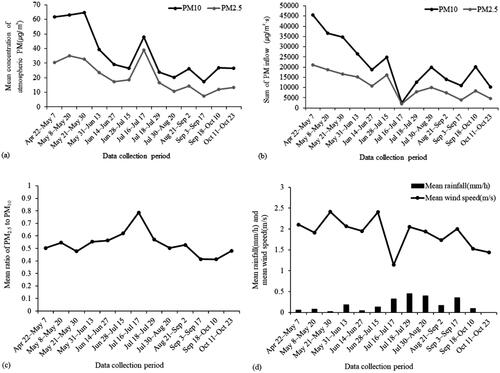
Table 1. Sampling dates, particulate matter (PM) data, and weather data during the experimental period in 2019.
Figure 2. Hourly rainfall during the study period.
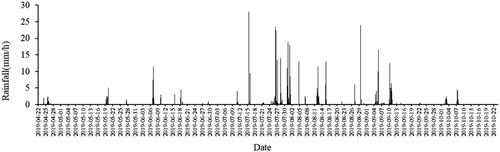
Table 2. Leaf surface morphological traits (data from Je et al. (Citation2020) and Son et al. (Citation2021), mean ± SD).
Table 3. The mass of surface particulate matter with a diameter less than 10 µm (PM10) accumulated on leaves in 2019.
Figure 3. The mass of surface particulate matter (PM) per unit leaf area of four tree species. (a) PM10, with a diameter less than 10 µm, (b) PM2.5, with a diameter less than 2.5 µm.
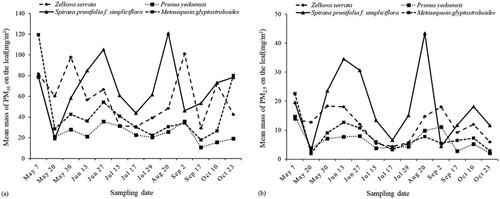
Table 4. The mass of surface particulate matter with a diameter less than 2.5 µm (PM2.5) accumulated on leaves in 2019.
Figure 4. The mean ratio of PM2.5 to PM10 accumulated on the leaves of four tree species.
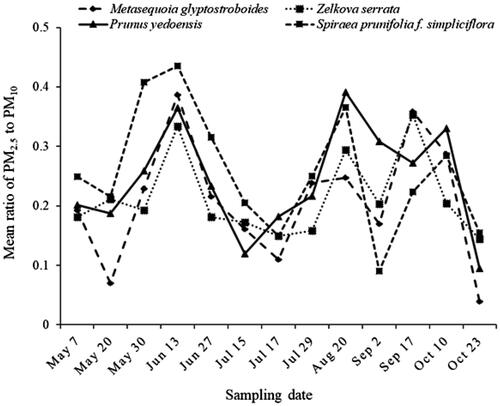
Table 5. The mean ratio of particulate matter with a diameter less than 2.5 µm to particulate matter with a diameter less than 10 µm for each species during the study period.
Table 6. The mass of particulate matter (PM) with a diameter less than 10 µm (PM10) and a diameter less than 2.5 µm (PM2.5) accumulated on leaves before (on 15 July 2019) and after (on 17 July 2019) rainfall event.