
Figures & data
Figure 1. Study area.
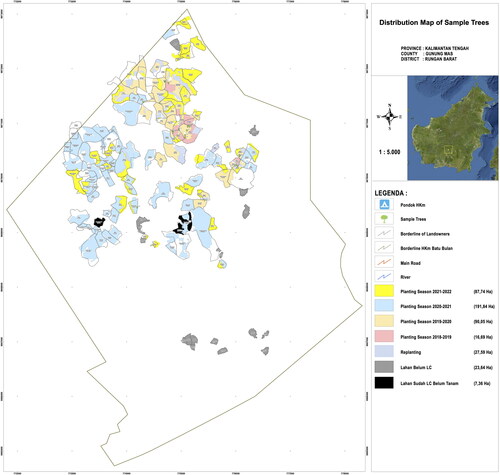
Table 1. Candidate models for biomass allometric equation development.
Table 2. Considered models for comparison.
Figure 2. Observed vs predicted plots of the AGB candidate models.
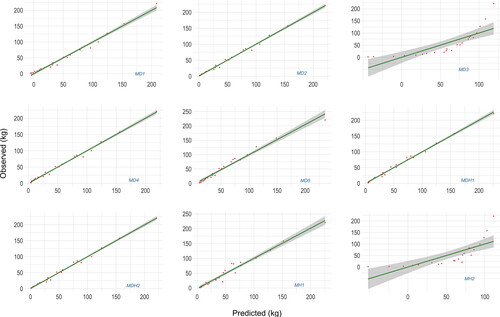
Figure 3. Residuals’ distribution of the AGB candidate models.
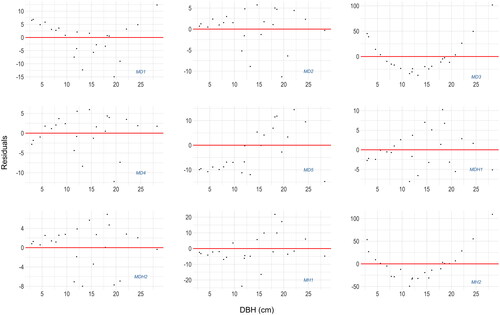
Table 3. Computed coefficients and comparative statistics of the AGB candidate models.
Figure 4. Identified AGB allometric model: MD2 (power function).
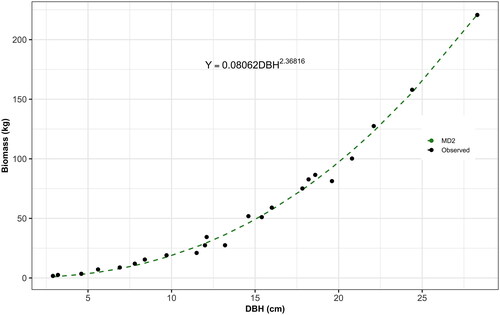
Figure 5. Graphical representation of the predictive accuracy of the allometric model identified in this study (MD2) against those considered from the literature.
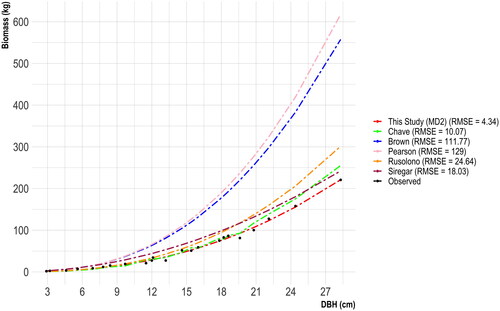
Figure 6. Illustration of the statistical significances among the AGB allometric models under consideration (*significant at α = 0.05, ns: not statistically significant at α = 0.05).
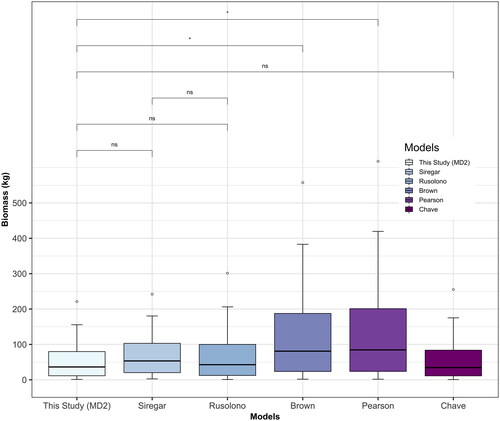
Table 4. Predictive accuracy metrics of the model identified in this study (MD2) and the models considered from the literature.
Figure 7. Illustration of the statistical significances among the indirect methods of AGB estimation in comparison to this study model (MD2).
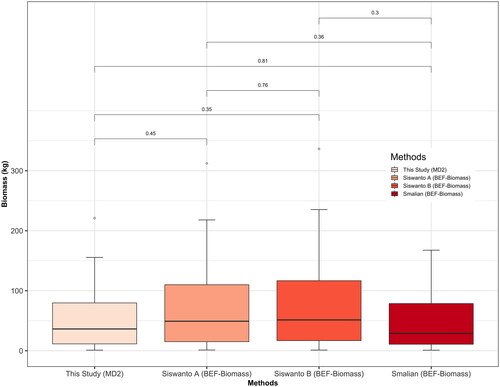
Table 5. Descriptive statistics of BEF, WBD and stem bole volume, and the AGB estimation using BEF-biomass method and this study model (MD2).
Data availability statement
Dataset used during this study are available from the corresponding author on plausible request.