Figures & data
Table 1. Carbon isotope analysis on SOC and soil DOC in forest ecosystems.
Figure 1. The location (red circle) and the boundary of the forested watersheds (red line) of this study. Soil samples were collected at orange triangle (Cryptomeria japonica stand) and circle (Quercus acutissima stand) points. The blue lines are streams. Stream samples were collected at green circles in the Bukmoongol (BM) and Baramgol (BR) watersheds.
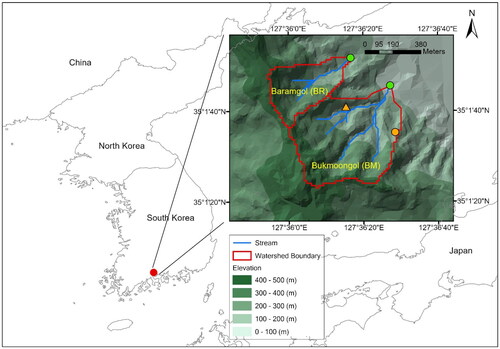
Figure 2. The relationships between SOC concentration and [WEOC] by (a) EC1, (b) EC2, and (c) EC3. Black triangles and dashed line are for Cryptomeria japonica and red circles and dashed line are for Quercus acutissima. Dashed lines are linear regression lines.
![Figure 2. The relationships between SOC concentration and [WEOC] by (a) EC1, (b) EC2, and (c) EC3. Black triangles and dashed line are for Cryptomeria japonica and red circles and dashed line are for Quercus acutissima. Dashed lines are linear regression lines.](/cms/asset/40fa3719-48fa-42a0-8ecd-63b8ded94ce3/tfst_a_2265966_f0002_c.jpg)
Table 2. Arithmetic mean and SE (standard error of the mean, n = 3) of the [WEOC] and cations.
Figure 3. The relationships between (a) δ13C-SOC and δ13C-WEOC and (b) Δ14C-SOC and Δ14C-WEOC. Black triangles are Cryptomeria japonica and red circles are Quercus acutissima. Dashed line is 1:1 line.
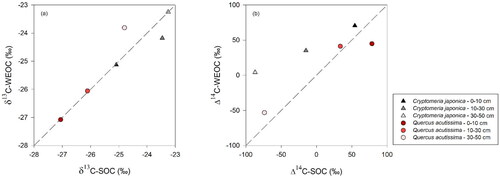
Figure 4. The relationships between stream [DOC] of the BM watershed ([DOC]BM) and stream [DOC] of the BR watershed ([DOC]BR). Black circles and red squares are weekly collected stream DOC and stream DOC during storm events, respectively. The four white circles are outliers of weekly collected samples (> mean + 3 S.D.) which were excluded in the linear regression. Black and red dashed lines are regression lines of weekly collected samples and storm samples, respectively. Gray solid line is 1:1 line.
![Figure 4. The relationships between stream [DOC] of the BM watershed ([DOC]BM) and stream [DOC] of the BR watershed ([DOC]BR). Black circles and red squares are weekly collected stream DOC and stream DOC during storm events, respectively. The four white circles are outliers of weekly collected samples (> mean + 3 S.D.) which were excluded in the linear regression. Black and red dashed lines are regression lines of weekly collected samples and storm samples, respectively. Gray solid line is 1:1 line.](/cms/asset/74fd9d03-b5d3-48ed-90cc-cc3c3ff230b2/tfst_a_2265966_f0004_c.jpg)
Figure 5. The relationships between the ratio of [DOC] to [sum of cations] and Δ14C-DOC of extracted soil solution (i.e. WEOC) under the two tree species and stream water. Black triangles are Cryptomeria japonica, and red circles are Quercus acutissima. Light to dark green symbols are stream water samples collected weekly and composited for each season, and during summer storms. Blue dashed line is the linear regression line for stream and extracted soil solution.
![Figure 5. The relationships between the ratio of [DOC] to [sum of cations] and Δ14C-DOC of extracted soil solution (i.e. WEOC) under the two tree species and stream water. Black triangles are Cryptomeria japonica, and red circles are Quercus acutissima. Light to dark green symbols are stream water samples collected weekly and composited for each season, and during summer storms. Blue dashed line is the linear regression line for stream and extracted soil solution.](/cms/asset/9fbe1044-4ec6-4f1f-9693-80fc07476d9d/tfst_a_2265966_f0005_c.jpg)
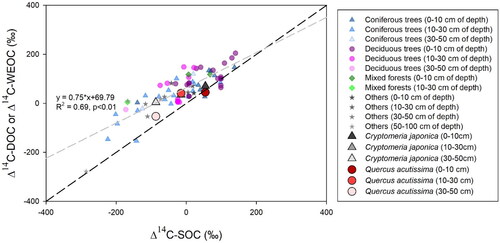
Figure 6. The relationships between Δ14C-SOC and Δ14C of soil DOC or soil WEOC. Data from nine previous studies are also included (). Blue triangles, purple circles, green diamonds, and gray stars are for conifers, deciduous trees, mixed forests, and other plants such as shrubs and grasses. Black triangles are for Cryptomeria japonica whereas red circles are for Quercus acutissima in this study. Gray and black dashed lines are linear regression line and 1:1 line, respectively.