
Figures & data
Figure 1. Map of SHFP showing the compartment understudy.
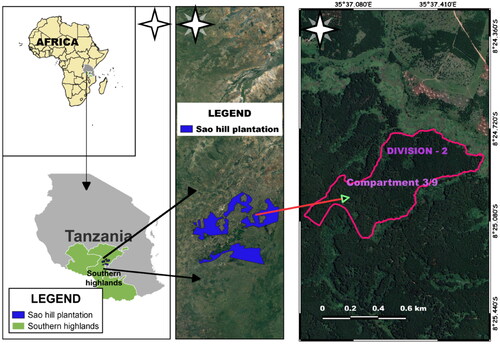
Figure 2. Sampling procedure used to select forest compartment understudy.
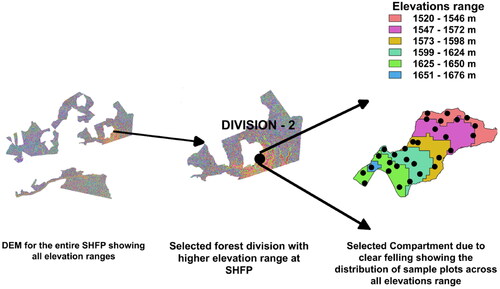
Table 1. GS descriptions
Figure 3. GS time distribution for each work element at a mean distance of 59.2 m and slope of 13.5%.
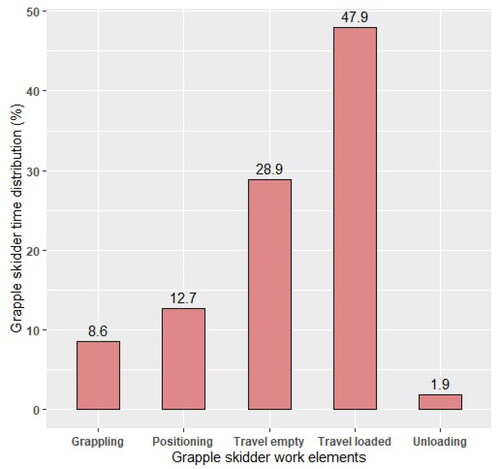
Table 2. Skidding summary statistics
Table 3. GS operational costs
Figure 4. Residual plots for all GS work elements and total productive time.
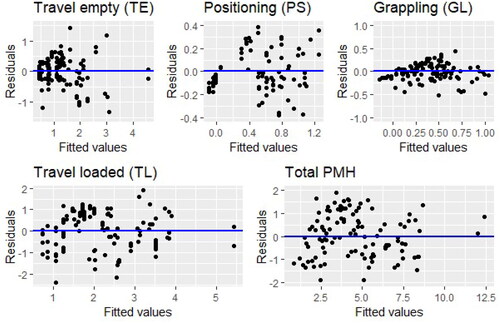
Table 4. GS time consumption model for individual work elements and total productive time.
Figure 5. Relationship between observed and predicted GS time on various work elements
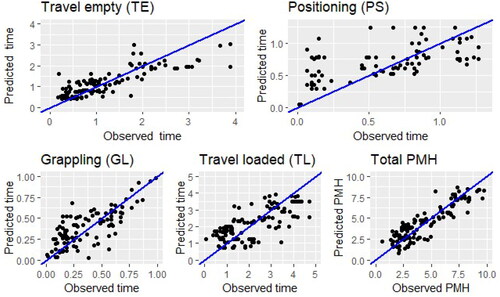
Figure 6. Residual and scatter plots for GS productivity and costs models
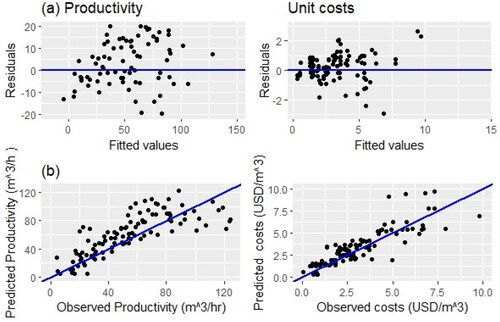
Figure 7. a. Error bars show the performance of productivity and cost models on various distances.
b. Error bars show the performance of productivity and cost models on various slopes.
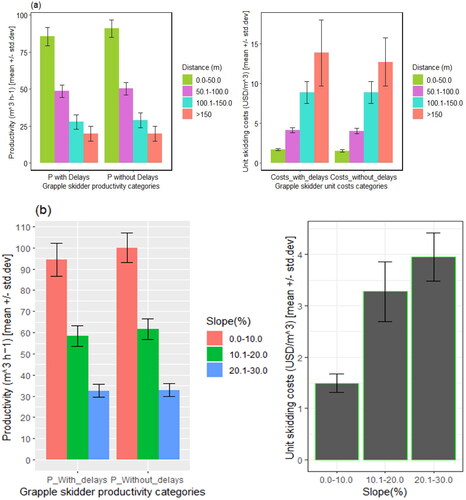
Table 5. Performance of productivity and cost models on various distances and slope classes.