Figures & data
Table 1. Origin and number of candidate tree plus
Figure 1. Collection sites of the Pongamia pinnata on the three islands.
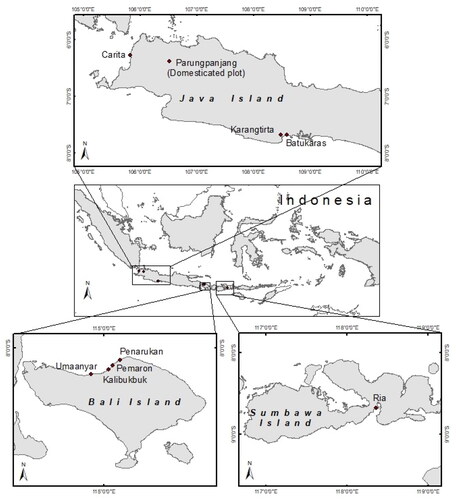
Table 2. Pearson’s correlation coefficients between variables
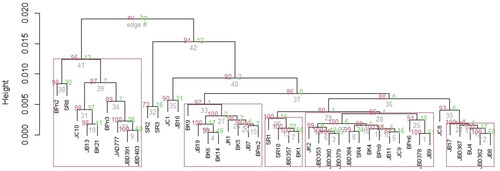
Figure 3. Clustering of 44 candidate plus trees (CPT) according to the pod and seed traitsRemarks: The values on the edges of the clustering represent p-values (%). The redcolored values show the AU (approximately unbiassed) p-values while the green-colored ones mean the BP (bootstrapt probability) values. Four red-colored rectangles in a bootstrap probability clustering represent clusters with the AU larger than 95%, which means that the results show rather strong correlation by the data.