Figures & data
Table 1. Elements of Just Transition.
Table 2. Timeline of the Australian automotive closures.
Figure 1. Labour force status by year.
Note: Wave 1 n = 1277; Wave 2 n = 886; Wave 3 n = 783.
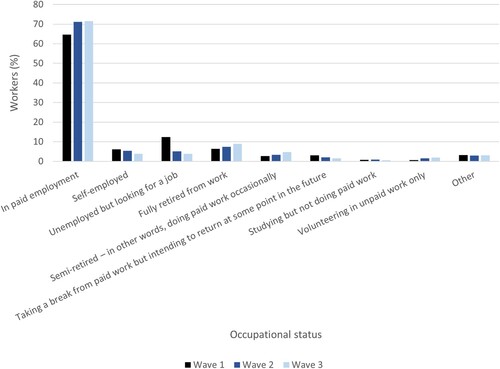
Figure 2. Change in employment situation, Waves 2 and 3.
Note: Wave 2 n = 679; Wave 3 n = 591.
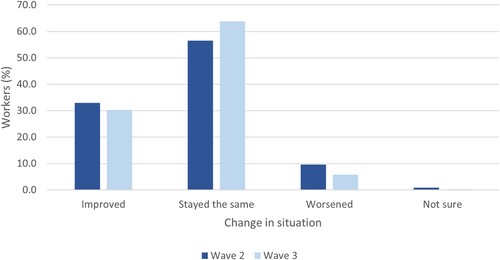
Figure 3. Reason for job change from Wave 2 to Wave 3.
Note: Wave 2 n = 58; Wave 3 n = 38.
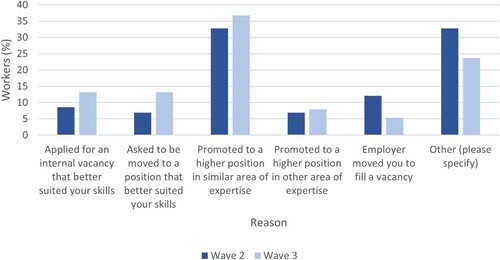
Figure 4. Remuneration by year.
Note: Wave 1 n = 824; Wave 2 n = 631; Wave 3 n = 561.
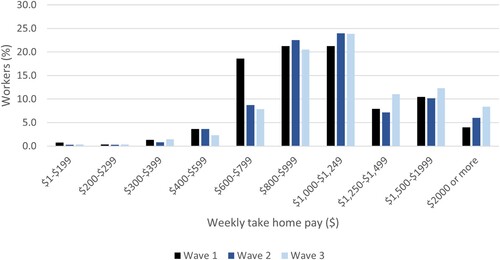
Figure 5. Weekly hours worked by year.
Note: Wave 1 n = 824; Wave 2 n = 631; Wave 3 n = 561.
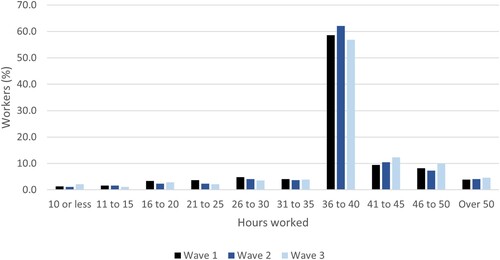
Figure 6. Employment arrangement, three waves.
Note: Wave 1 n = 824; Wave 2 n = 603; Wave 3 n = 537.
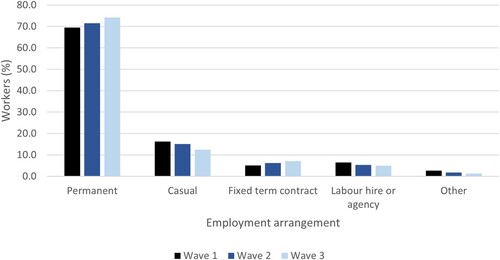
Figure 7. Sense of security in main job, three waves.
Note: Wave 1 n = 824; Wave 2 n = 631; Wave 3 n = 550.
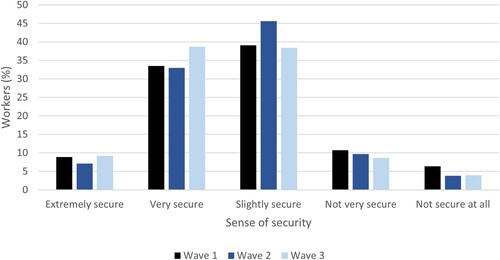
Figure 8. Incidence of financial stress as a result of leaving the auto industry, Waves 2 and 3.
Note: Wave 2 n = 886; Wave 3 n = 783.
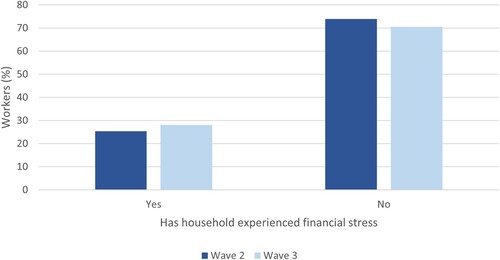
Figure 9. Change in financial situation since interviewed/leaving auto-industry, by year.
Note: Wave 1 n = 1265; Wave 2 n = 886; Wave 3 n = 783.
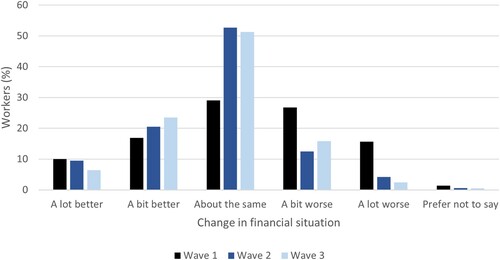
Figure 10. Relevance of knowledge and skills from the auto industry, repeat cross-sectional.
Note: Wave 1 n = 824; Wave 2 n = 631; Wave 3 n = 550.
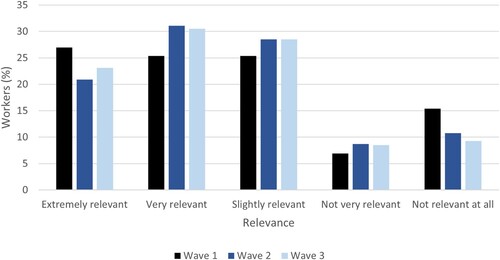
Figure 11. Job satisfaction with new employer, three waves.
Note: Wave 1 n = 824; Wave 2 n = 631; Wave 3 n = 550.
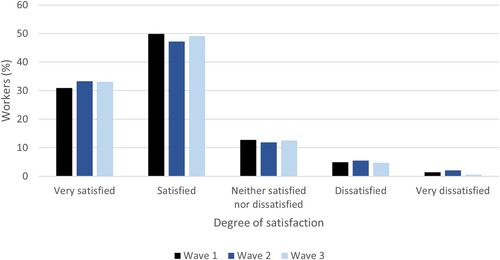
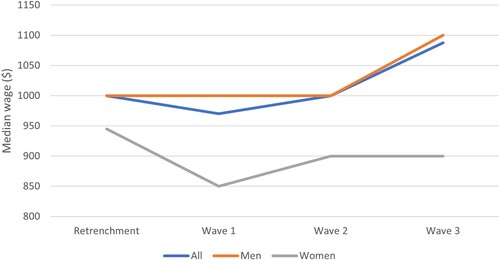
Figure 12. Median wages by gender, retrenchment to Wave 3.