
Figures & data
Table 1. Table presenting museums used in this research.
Figure 1. Bar graph showing number of digital visits to each museum.
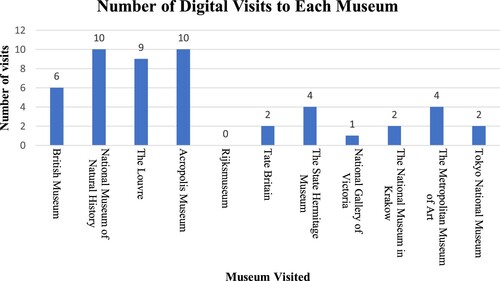
Figure 2. Bar graph of mean percentage change in PANAS negative measures
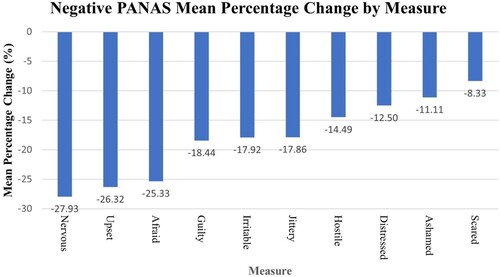
Table 2. Table presenting significance (p-value), standard deviation, and range change of PANAS measures.
Figure 3. Bar graph showing mean percentage changes in PANAS positive measures.
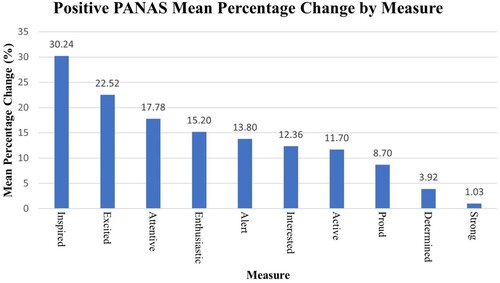
Figure 4. Bar chart presenting mean percentage change in MWS measures.
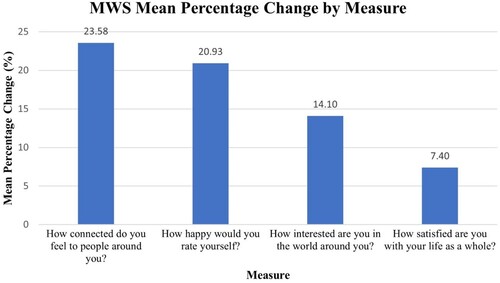
Table 3. Table presenting significance (p-value), standard deviation, and range change of MWS measures.
Table 4. Table presenting the mean starting scores of in-person and digital PANAS measures.
Table 5. Table presenting the mean starting scores of in-person and digital MWS measures.