583
Views
2
CrossRef citations to date
0
Altmetric
Research Paper

Intermolecular interactions involving an acidic patch on immunoglobulin variable domain and the γ2 constant region mediate crystalline inclusion body formation in the endoplasmic reticulum

ORCID Icon, , ORCID Icon, , & ORCID Icon
Article: e1361499 | Received 28 Jun 2017, Accepted 25 Jul 2017, Published online: 13 Sep 2017

Figures & data

Figure 1. Generation of a model human IgG mAb-3 possessing an acidic patch on the variable domain surface. (A) Schematic depiction of model mAbs. Two antibodies shown at the top are mAb-1 (IgG2κ) colored in orange and mAb-2 (IgG2λ) in green. Red circles located on the mAb-1's HC and mAb-2's LC represent the areas where negatively charged amino acids are densely located. Five Asp residues are in mAb-1 CDR-H3. Three Asp residues are in mAb-2 CDR-L2. The mAb-1 γ2-HC was paired with the mAb-2 λ-LC to generate mAb-3. Similarly, the mAb-1 κ-LC was paired with the mAb-2 γ2-HC to generate mAb-4 (shown in box). (B) A homology model showing the variable fragment of mAb-3. The surface is color-coded by the underlying amino acid residue charge in which red is negative, blue is positive, and white is neutral. VH, heavy chain variable domain. VL, light chain variable domain. (C) An overlay of the surface model and a corresponding ribbon diagram. Individual Asp residues comprising the prominent acidic patch are shown with the respective residue using the AHo numbering systemCitation33. Asp residues on CDR-H3 are shown in yellow background, while Asp residues on CDR-L2 are shown in green background.
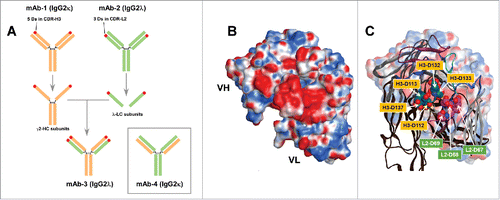
Figure 1. Generation of a model human IgG mAb-3 possessing an acidic patch on the variable domain surface. (A) Schematic depiction of model mAbs. Two antibodies shown at the top are mAb-1 (IgG2κ) colored in orange and mAb-2 (IgG2λ) in green. Red circles located on the mAb-1's HC and mAb-2's LC represent the areas where negatively charged amino acids are densely located. Five Asp residues are in mAb-1 CDR-H3. Three Asp residues are in mAb-2 CDR-L2. The mAb-1 γ2-HC was paired with the mAb-2 λ-LC to generate mAb-3. Similarly, the mAb-1 κ-LC was paired with the mAb-2 γ2-HC to generate mAb-4 (shown in box). (B) A homology model showing the variable fragment of mAb-3. The surface is color-coded by the underlying amino acid residue charge in which red is negative, blue is positive, and white is neutral. VH, heavy chain variable domain. VL, light chain variable domain. (C) An overlay of the surface model and a corresponding ribbon diagram. Individual Asp residues comprising the prominent acidic patch are shown with the respective residue using the AHo numbering systemCitation33. Asp residues on CDR-H3 are shown in yellow background, while Asp residues on CDR-L2 are shown in green background.

Table 1. Selected physicochemical properties of human IgG mAbs.

Figure 2. Model mAb-3 is secretion competent. (A) Cell culture media and whole cell lysate samples were prepared on day-7 post transfection and were subjected to SDS-PAGE followed by Western blot using rabbit anti-human IgG (H+L) polysera. Harvested cell culture medium was loaded and analyzed under reducing conditions (lanes 1–3) or non-reducing conditions (lanes 7–9). Whole cell lysates were loaded under reducing conditions (lanes 4–6). Expected band for heavy chain (HC), light chain (LC), or the whole IgG is marked by arrowhead and labeled accordingly. Anti-GAPDH blot is shown at the bottom as a loading reference. Both γ2-HC (lanes 2, 8) and λ-LC (lanes 3, 9) were secretion incompetent by themselves. The used constructs are shown at the top of corresponding lanes. (B) On day-2 post transfection, cell culture media were replaced with fresh growth media with or without 15 μg/ml BFA and maintained in suspension format for 24 hr until day-3 when the cell culture media and cell pellets were harvested and analyzed. The amount of mAb-3 protein secreted to the culture medium during the 24 hr BFA treatment is in lanes 1–2 (reducing conditions) and lanes 5–6 (non-reducing conditions). The amount of IgGs detected in the cell lysates is shown in lanes 3–4 (reducing conditions). Anti-GAPDH blot is shown as a loading reference for cell lysate samples. (C) Expression analysis of mAb-4. Cell culture media and whole cell lysate samples were prepared on day-7 post transfection and were analyzed as above. Expected band for HC, LC, or whole IgG is marked by arrowhead and labeled. (D) Expression comparison of mAb-3 and mAb-4. Cell culture media were harvested from mAb-3 and mAb-4 transfected cells on day-7 post transfection and analyzed under reducing (lanes 1, 2) or non-reducing (lanes 3, 4) conditions. SDS-PAGE gel was stained by Coomassie blue.
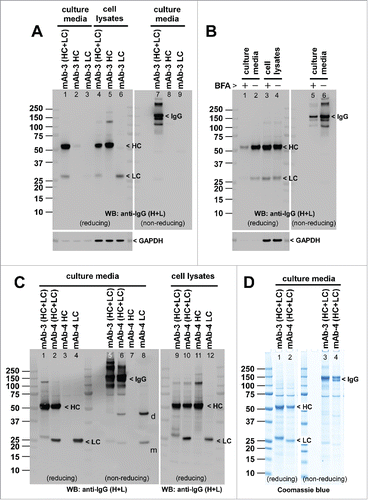
Figure 2. Model mAb-3 is secretion competent. (A) Cell culture media and whole cell lysate samples were prepared on day-7 post transfection and were subjected to SDS-PAGE followed by Western blot using rabbit anti-human IgG (H+L) polysera. Harvested cell culture medium was loaded and analyzed under reducing conditions (lanes 1–3) or non-reducing conditions (lanes 7–9). Whole cell lysates were loaded under reducing conditions (lanes 4–6). Expected band for heavy chain (HC), light chain (LC), or the whole IgG is marked by arrowhead and labeled accordingly. Anti-GAPDH blot is shown at the bottom as a loading reference. Both γ2-HC (lanes 2, 8) and λ-LC (lanes 3, 9) were secretion incompetent by themselves. The used constructs are shown at the top of corresponding lanes. (B) On day-2 post transfection, cell culture media were replaced with fresh growth media with or without 15 μg/ml BFA and maintained in suspension format for 24 hr until day-3 when the cell culture media and cell pellets were harvested and analyzed. The amount of mAb-3 protein secreted to the culture medium during the 24 hr BFA treatment is in lanes 1–2 (reducing conditions) and lanes 5–6 (non-reducing conditions). The amount of IgGs detected in the cell lysates is shown in lanes 3–4 (reducing conditions). Anti-GAPDH blot is shown as a loading reference for cell lysate samples. (C) Expression analysis of mAb-4. Cell culture media and whole cell lysate samples were prepared on day-7 post transfection and were analyzed as above. Expected band for HC, LC, or whole IgG is marked by arrowhead and labeled. (D) Expression comparison of mAb-3 and mAb-4. Cell culture media were harvested from mAb-3 and mAb-4 transfected cells on day-7 post transfection and analyzed under reducing (lanes 1, 2) or non-reducing (lanes 3, 4) conditions. SDS-PAGE gel was stained by Coomassie blue.

Figure 3. The mAb-3 expressing cells induce needle-like crystalline inclusion bodies when ER-to-Golgi transport is blocked. Fluorescent micrographs of HEK293 cells transfected to express mAb-3. On day-2 post transfection, HEK293 cells were resuspended in fresh cell culture media with or without 15 μg/ml BFA, then immediately seeded onto poly-lysine coated glass coverslips and statically cultured for 24 hr. On day-3, cells were fixed, permeabilized, and immuno-stained. Co-staining was performed by using FITC-conjugated anti-gamma chain and Texas Red-conjugated anti-lambda chain polyclonal antibodies. Green and red image fields were superimposed to create ‘merge’ views. DIC and ‘merge’ were superimposed to generate ‘overlay’ views. (A) Subcellular localization of gamma-chain and lambda-chain in co-transfected cells was visualized under steady-state normal cell growth conditions. Two representative image fields are shown. (B) Gamma- and lambda-chains of the mAb-3 were visualized after 24 hr BFA treatment. Five representative image fields are shown. Crystal-laden cells are pointed by arrowheads in DIC images. The CB phenotype frequency after the BFA treatment is stated in the text. Unlabeled scale bar represents 10 μm.
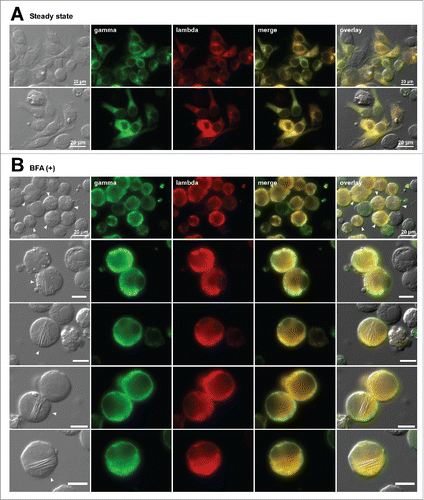
Figure 3. The mAb-3 expressing cells induce needle-like crystalline inclusion bodies when ER-to-Golgi transport is blocked. Fluorescent micrographs of HEK293 cells transfected to express mAb-3. On day-2 post transfection, HEK293 cells were resuspended in fresh cell culture media with or without 15 μg/ml BFA, then immediately seeded onto poly-lysine coated glass coverslips and statically cultured for 24 hr. On day-3, cells were fixed, permeabilized, and immuno-stained. Co-staining was performed by using FITC-conjugated anti-gamma chain and Texas Red-conjugated anti-lambda chain polyclonal antibodies. Green and red image fields were superimposed to create ‘merge’ views. DIC and ‘merge’ were superimposed to generate ‘overlay’ views. (A) Subcellular localization of gamma-chain and lambda-chain in co-transfected cells was visualized under steady-state normal cell growth conditions. Two representative image fields are shown. (B) Gamma- and lambda-chains of the mAb-3 were visualized after 24 hr BFA treatment. Five representative image fields are shown. Crystal-laden cells are pointed by arrowheads in DIC images. The CB phenotype frequency after the BFA treatment is stated in the text. Unlabeled scale bar represents 10 μm.

Figure 4. Needle-like crystalline inclusions co-localize with ER resident proteins. Fluorescent micrographs of HEK293 cells transfected to express mAb-3. On day-2 post transfection, HEK293 cells were resuspended in fresh cell culture media containing 15 μg/ml BFA, then immediately seeded onto poly-lysine coated glass coverslips and statically cultured for 24 hr. On day-3, cells were fixed, permeabilized, and immuno-stained. (A) Co-staining was performed by using Alexa Fluor 488-conjugated Protein A and Alexa Fluor 594-conjugated Fab fragments generated from goat anti-human IgG (H+L) polysera. (B, C) Transfected cells were co-stained with Alexa Fluor 488-conjugated Protein A and anti-ERp57 (B) or anti-BiP (C). Green and red image fields were superimposed to create ‘merge’ views. Scale bars represent 10 μm.
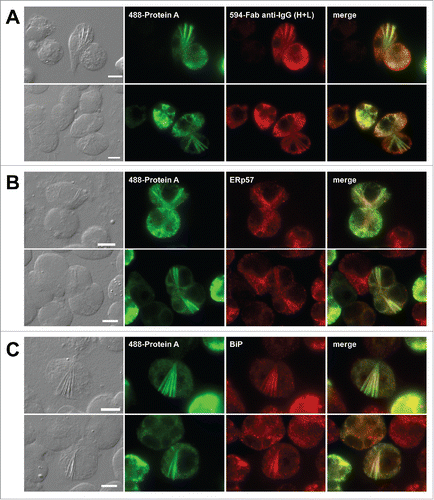
Figure 4. Needle-like crystalline inclusions co-localize with ER resident proteins. Fluorescent micrographs of HEK293 cells transfected to express mAb-3. On day-2 post transfection, HEK293 cells were resuspended in fresh cell culture media containing 15 μg/ml BFA, then immediately seeded onto poly-lysine coated glass coverslips and statically cultured for 24 hr. On day-3, cells were fixed, permeabilized, and immuno-stained. (A) Co-staining was performed by using Alexa Fluor 488-conjugated Protein A and Alexa Fluor 594-conjugated Fab fragments generated from goat anti-human IgG (H+L) polysera. (B, C) Transfected cells were co-stained with Alexa Fluor 488-conjugated Protein A and anti-ERp57 (B) or anti-BiP (C). Green and red image fields were superimposed to create ‘merge’ views. Scale bars represent 10 μm.

Figure 5. Crystalline inclusion bodies are not induced if γ2-HC or λ-LC of mAb-3 is replaced by an isotype-matched subunit chain. Fluorescent micrographs of HEK293 cells transfected with (A) mAb-3 γ2-HC and unrelated isotype-matched λ-LC (denoted as lambda-LC*) and (B) mAb-3 λ-LC and mAb-2 γ2-HC (denoted as gamma2-HC*). On day-2 post transfection, HEK293 cells were resuspended in fresh cell culture media with or without 15 μg/ml BFA, then immediately seeded onto poly-lysine coated glass coverslips and statically cultured for 24 hr. On day-3, cells were fixed, permeabilized, and immuno-stained. Co-staining was performed by using FITC-conjugated anti-gamma chain and Texas Red-conjugated anti-lambda chain polyclonal antibodies. In panels A and B, first two rows are the representative image fields under steady-state growth conditions, whereas rows three and four are under BFA treatment. Green and red image fields were superimposed to create ‘merge’ views. DIC and ‘merge’ were superimposed to generate ‘overlay’ views.
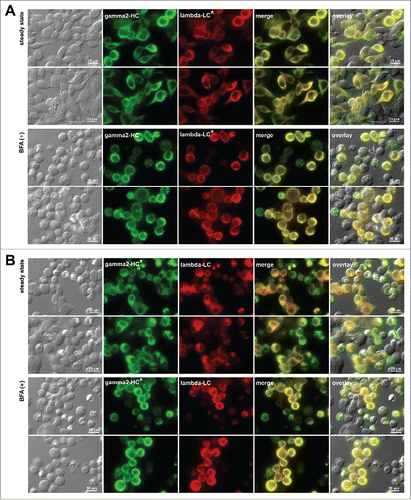
Figure 5. Crystalline inclusion bodies are not induced if γ2-HC or λ-LC of mAb-3 is replaced by an isotype-matched subunit chain. Fluorescent micrographs of HEK293 cells transfected with (A) mAb-3 γ2-HC and unrelated isotype-matched λ-LC (denoted as lambda-LC*) and (B) mAb-3 λ-LC and mAb-2 γ2-HC (denoted as gamma2-HC*). On day-2 post transfection, HEK293 cells were resuspended in fresh cell culture media with or without 15 μg/ml BFA, then immediately seeded onto poly-lysine coated glass coverslips and statically cultured for 24 hr. On day-3, cells were fixed, permeabilized, and immuno-stained. Co-staining was performed by using FITC-conjugated anti-gamma chain and Texas Red-conjugated anti-lambda chain polyclonal antibodies. In panels A and B, first two rows are the representative image fields under steady-state growth conditions, whereas rows three and four are under BFA treatment. Green and red image fields were superimposed to create ‘merge’ views. DIC and ‘merge’ were superimposed to generate ‘overlay’ views.

Figure 6. Individual subunit chains of mAb-3 do not induce crystalline inclusion bodies. Fluorescent micrographs of HEK293 cells transfected with (A) mAb-3 λ-LC construct alone, (B) mAb-3 γ2-HC construct alone, (C) Asp-to-Ala mutated mAb-3 λ-LC alone, and (D) Asp-to-Ala mutated mAb-3 γ2-HC alone. On day-2 post transfection, suspension cultured cells were seeded onto poly-lysine coated glass coverslips and statically cultured for 24 hr. On day-3, cells were fixed, permeabilized, and co-stained with anti-CD147 and anti-lambda chain (A and C). In panels B and D, cells were co-stained with anti-CD147 and anti-gamma chain. Endogenous CD147 was stained to highlight cell shapes. Green and red image fields were superimposed to create ‘merge’ views. DIC and ‘red’ were superimposed to generate ‘overlay’ views. Unlabeled scale bar represents 10 μm.
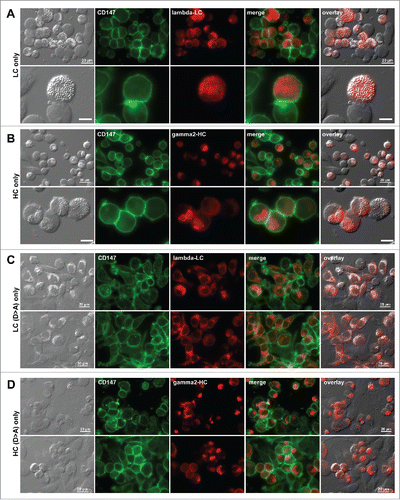
Figure 6. Individual subunit chains of mAb-3 do not induce crystalline inclusion bodies. Fluorescent micrographs of HEK293 cells transfected with (A) mAb-3 λ-LC construct alone, (B) mAb-3 γ2-HC construct alone, (C) Asp-to-Ala mutated mAb-3 λ-LC alone, and (D) Asp-to-Ala mutated mAb-3 γ2-HC alone. On day-2 post transfection, suspension cultured cells were seeded onto poly-lysine coated glass coverslips and statically cultured for 24 hr. On day-3, cells were fixed, permeabilized, and co-stained with anti-CD147 and anti-lambda chain (A and C). In panels B and D, cells were co-stained with anti-CD147 and anti-gamma chain. Endogenous CD147 was stained to highlight cell shapes. Green and red image fields were superimposed to create ‘merge’ views. DIC and ‘red’ were superimposed to generate ‘overlay’ views. Unlabeled scale bar represents 10 μm.

Figure 7. IgG1 version of mAb-3 does not induce crystalline inclusion bodies. (A) Cell culture media were harvested on day-7 post transfection and were subjected to SDS-PAGE under reducing conditions (lanes 1–5) or non-reducing conditions (lanes 11–15). Cell lysates were analyzed under reducing conditions (lanes 6–10). Western blotting was performed using anti-human IgG (H+L) polysera. Constructs used are shown at the top of corresponding lanes. Expected band for HC, LC, or the whole IgG is marked by arrowhead and labeled. (B) The same set of samples analyzed in panel A were stained by Coomassie blue dye. (C, D) Fluorescent micrographs of HEK293 cells expressing the IgG1 version of mAb-3. On day-2 post transfection, HEK293 cells were resuspended in fresh cell culture media with or without 15 μg/ml BFA, then seeded onto poly-lysine coated glass coverslips and statically cultured for 24 hr. On day-3, cells were fixed, permeabilized, and immuno-stained. Co-staining was performed by using FITC-conjugated anti-gamma chain and Texas Red-conjugated anti-lambda chain polyclonal antibodies. Green and red image fields were superimposed to create ‘merge’ views. DIC and ‘merge’ were superimposed to generate ‘overlay’ views. (E) Fluorescent micrographs of HEK293 cells transfected with the γ1 version of mAb-3 HC construct alone. On day-3, cells were fixed, permeabilized, and co-stained with anti-CD147 and anti-gamma chain. Green and red image fields were superimposed to create ‘merge’ views. DIC and ‘red’ were superimposed to generate ‘overlay’ views.
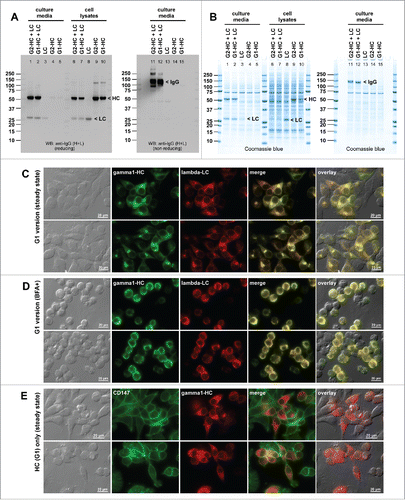
Figure 7. IgG1 version of mAb-3 does not induce crystalline inclusion bodies. (A) Cell culture media were harvested on day-7 post transfection and were subjected to SDS-PAGE under reducing conditions (lanes 1–5) or non-reducing conditions (lanes 11–15). Cell lysates were analyzed under reducing conditions (lanes 6–10). Western blotting was performed using anti-human IgG (H+L) polysera. Constructs used are shown at the top of corresponding lanes. Expected band for HC, LC, or the whole IgG is marked by arrowhead and labeled. (B) The same set of samples analyzed in panel A were stained by Coomassie blue dye. (C, D) Fluorescent micrographs of HEK293 cells expressing the IgG1 version of mAb-3. On day-2 post transfection, HEK293 cells were resuspended in fresh cell culture media with or without 15 μg/ml BFA, then seeded onto poly-lysine coated glass coverslips and statically cultured for 24 hr. On day-3, cells were fixed, permeabilized, and immuno-stained. Co-staining was performed by using FITC-conjugated anti-gamma chain and Texas Red-conjugated anti-lambda chain polyclonal antibodies. Green and red image fields were superimposed to create ‘merge’ views. DIC and ‘merge’ were superimposed to generate ‘overlay’ views. (E) Fluorescent micrographs of HEK293 cells transfected with the γ1 version of mAb-3 HC construct alone. On day-3, cells were fixed, permeabilized, and co-stained with anti-CD147 and anti-gamma chain. Green and red image fields were superimposed to create ‘merge’ views. DIC and ‘red’ were superimposed to generate ‘overlay’ views.

Figure 8. Stepwise neutralization of acidic surface patch progressively diminishes mAb-3 secretion. HEK293 cells were co-transfected with the parental subunits or the Asp-to-Ala mutated subunits in various combination. Cell culture media were harvested on day-7 post transfection and were analyzed by SDS-PAGE under reducing (A) or non-reducing (B) conditions followed by Coomassie blue staining. Whole cell lysates were loaded under reducing conditions (C) followed by Western blotting using anti-human IgG (H+L) polysera. Expected band for HC, LC, or the whole IgG is marked by arrowhead and labeled. Anti-GAPDH blot is shown as a loading reference for cell lysate samples.
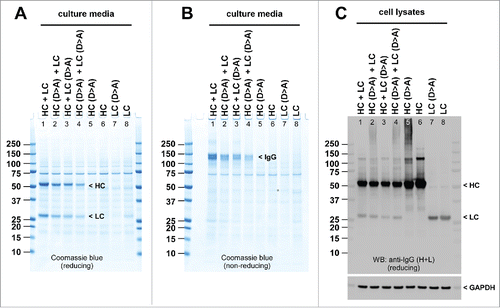
Figure 8. Stepwise neutralization of acidic surface patch progressively diminishes mAb-3 secretion. HEK293 cells were co-transfected with the parental subunits or the Asp-to-Ala mutated subunits in various combination. Cell culture media were harvested on day-7 post transfection and were analyzed by SDS-PAGE under reducing (A) or non-reducing (B) conditions followed by Coomassie blue staining. Whole cell lysates were loaded under reducing conditions (C) followed by Western blotting using anti-human IgG (H+L) polysera. Expected band for HC, LC, or the whole IgG is marked by arrowhead and labeled. Anti-GAPDH blot is shown as a loading reference for cell lysate samples.

Figure 9. Neutralization of acidic patch leads to Russell body induction. Fluorescent micrographs of HEK293 cells transfected with the following construct(s): (A) the parental HC and LC subunits; (B) Asp-to-Ala mutated version of HC and the parental LC; (C) the parental HC and Asp-to-Ala mutated version of LC; (D) Asp-to-Ala mutated versions of HC and LC subunits. On day-2 post transfection, suspension cultured cells were seeded onto poly-lysine coated glass coverslips and statically cultured for 24 hr. On day-3, cells were fixed, permeabilized, and immunostained. Co-staining was carried out with FITC-conjugated anti-gamma chain and Texas Red-conjugated anti-lambda chain polyclonal antibodies. Green and red image fields were superimposed to create ‘merge’ views. DIC and ‘merge’ were superimposed to generate ‘overlay’ views.
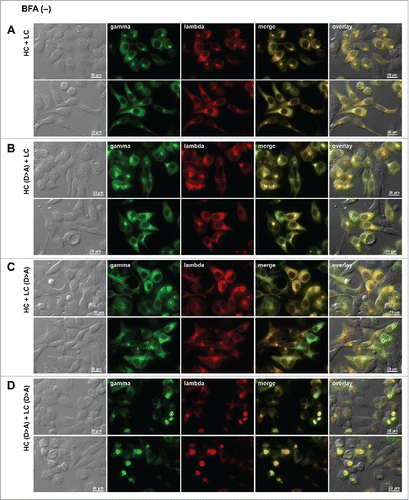
Figure 9. Neutralization of acidic patch leads to Russell body induction. Fluorescent micrographs of HEK293 cells transfected with the following construct(s): (A) the parental HC and LC subunits; (B) Asp-to-Ala mutated version of HC and the parental LC; (C) the parental HC and Asp-to-Ala mutated version of LC; (D) Asp-to-Ala mutated versions of HC and LC subunits. On day-2 post transfection, suspension cultured cells were seeded onto poly-lysine coated glass coverslips and statically cultured for 24 hr. On day-3, cells were fixed, permeabilized, and immunostained. Co-staining was carried out with FITC-conjugated anti-gamma chain and Texas Red-conjugated anti-lambda chain polyclonal antibodies. Green and red image fields were superimposed to create ‘merge’ views. DIC and ‘merge’ were superimposed to generate ‘overlay’ views.

Figure 10. Loss of acidic surface patch promotes Russell body induction under ER-to-Golgi transport block. Fluorescent micrographs of HEK293 cells transfected with the following construct(s): (A) the parental HC and LC subunits; (B) Asp-to-Ala mutated version of HC and the parental LC; (C) the parental HC and Asp-to-Ala mutated version of LC; (D) Asp-to-Ala mutated versions of HC and LC subunits. On day-2 post transfection, HEK293 cells were resuspended in fresh cell culture media containing 15 μg/ml BFA, then seeded onto poly-lysine coated glass coverslips and statically cultured for 24 hr. On day-3, cells were fixed, permeabilized, and co-stained with FITC-conjugated anti-gamma chain and Texas Red-conjugated anti-lambda chain polyclonal antibodies. Green and red image fields were superimposed to create ‘merge’ views. DIC and ‘merge’ were superimposed to generate ‘overlay’ views. Crystal-laden cells are pointed by arrowheads in panel A. Unlabeled scale bar, 10 μm.
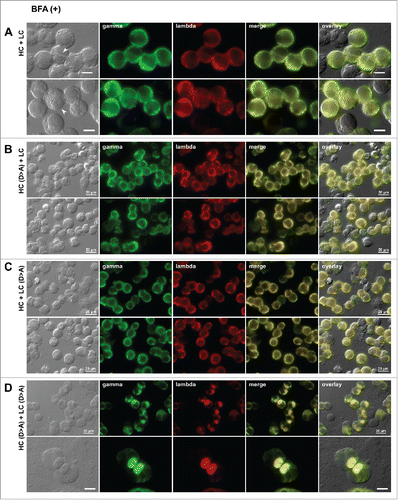
Figure 10. Loss of acidic surface patch promotes Russell body induction under ER-to-Golgi transport block. Fluorescent micrographs of HEK293 cells transfected with the following construct(s): (A) the parental HC and LC subunits; (B) Asp-to-Ala mutated version of HC and the parental LC; (C) the parental HC and Asp-to-Ala mutated version of LC; (D) Asp-to-Ala mutated versions of HC and LC subunits. On day-2 post transfection, HEK293 cells were resuspended in fresh cell culture media containing 15 μg/ml BFA, then seeded onto poly-lysine coated glass coverslips and statically cultured for 24 hr. On day-3, cells were fixed, permeabilized, and co-stained with FITC-conjugated anti-gamma chain and Texas Red-conjugated anti-lambda chain polyclonal antibodies. Green and red image fields were superimposed to create ‘merge’ views. DIC and ‘merge’ were superimposed to generate ‘overlay’ views. Crystal-laden cells are pointed by arrowheads in panel A. Unlabeled scale bar, 10 μm.

Reprints and Corporate Permissions

Please note: Selecting permissions does not provide access to the full text of the article, please see our help page How do I view content?

To request a reprint or corporate permissions for this article, please click on the relevant link below:

Academic Permissions

Please note: Selecting permissions does not provide access to the full text of the article, please see our help page How do I view content?

Obtain permissions instantly via Rightslink by clicking on the button below:

If you are unable to obtain permissions via Rightslink, please complete and submit this Permissions form. For more information, please visit our Permissions help page.