
Figures & data
Figure 1. SalmoLyse® reduces Salmonella contamination on various food surfaces: Mean and standard error bars shown. Statistical analyses were carried out for each food group independently. Asterisks denote significant reduction from corresponding controls based on one-way ANOVA with Tukey's post-hoc tests for multiple corrections: ** denotes P < 0.01, while *** denotes P < 0.001 compared to the corresponding controls. There was significant reduction in Salmonella on all food surfaces with the addition of SalmoLyse® compared to the controls; the mean percent reductions from the control are noted in the boxes above treatment bars. CFU/g = colony forming units per gram. Each letter denotes a food group that was tested with SalmoLyse® and compared to a control: A= chicken; B= lettuce; C= tuna; D= cantaloupe; E = ground turkey.
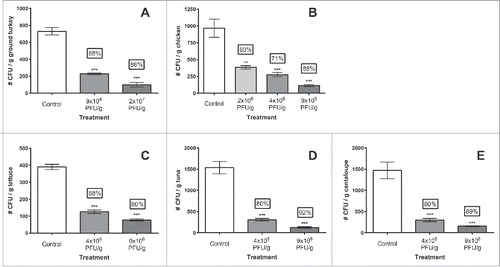
Table 1. Summary of the raw pet food ingredient experiments on turkey trim, chicken, tuna, cantaloupe, and lettuce. All phage treatments are significantly (P < 0.01) reduced from their corresponding control.