Figures & data
Figure 1. Treaty of Perpetual Peace, 1686.
Source: https://commons.wikimedia.org/w/index.php?curid=44247299 and https://upload.wikimedia.org/wikipedia/commons/8/8d/Polish-Russian_peace_treaty_1686.JPG.
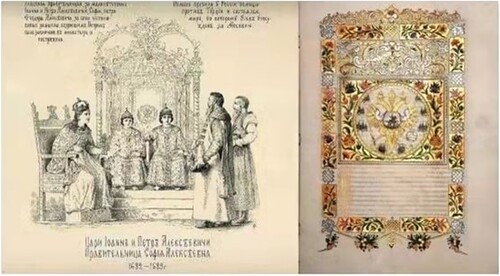
Figure 2. Ukraine through the ages.
Note: Soviet era oblast borders are not always exactly the same as those of former historical regions of Ukraine, especially in the lower Dnieper area.
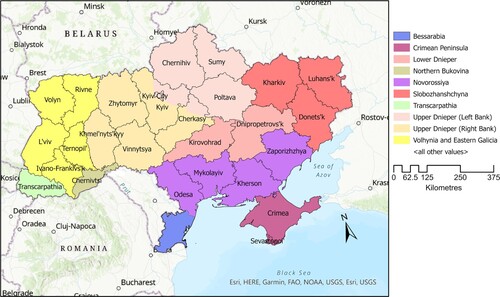
Figure 5. GDP evolutions in selected former Soviet republics and Poland, 1989–2020.
Source: The Conference Board (Citation2022).
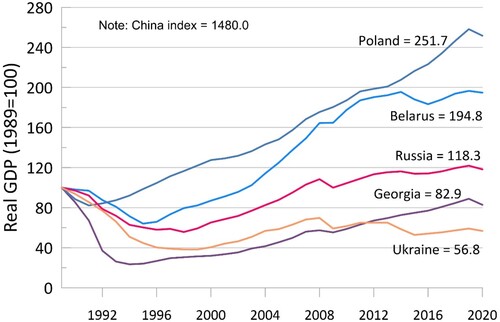
Figure 3. Ukrainian 2004 and 2010 presidential elections.
Notes: The figures refer to the share of votes for the candidate receiving the largest share in each area. The reddish tones refer to places where Yanukovych came first.
Source: Office for Democratic Institutions and Human Rights (ODIHR). www.osce.org/odhir.
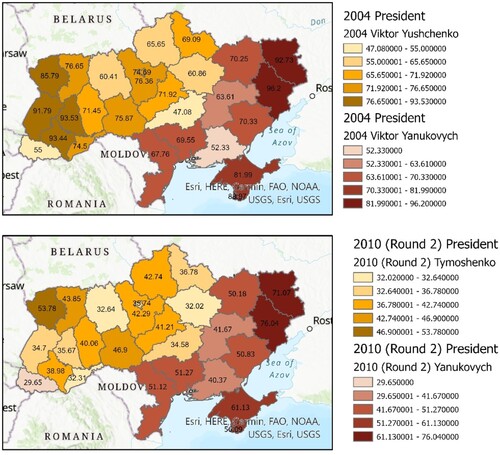
Figure 8. Ukraine’s trade with the EU28, Russia and China, 1996–2021.
Note: This data excludes Crimea and the two People’s Republics from 2014.
Sources: Elaborated from Ukrainian regional GDP, 2003–2019 and from State Statistics Service of Ukraine, Citation2022. http://www.ukrstat.gov.ua/.
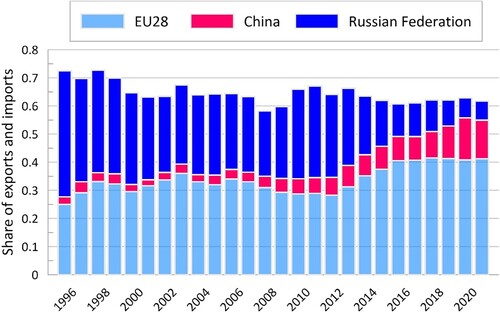
Figure 4. Number of explosions in Donbass, February 2022.
Source: OSCE Special Monitoring Mission to Ukraine (SMM) Daily Reports, www.osce.org. For 12th and 13th and 19th and 20th two-day figure partitioned approximately in the light of the number of ceasefire violations.
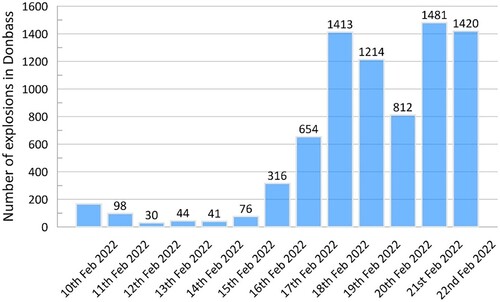
Figure 6. Population change in Ukraine, 1990–2020.
Source: Elaborated from State Statistics Service of Ukraine, Citation2022. http://www.ukrstat.gov.ua/.
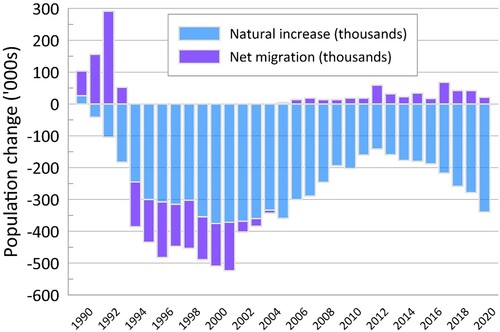
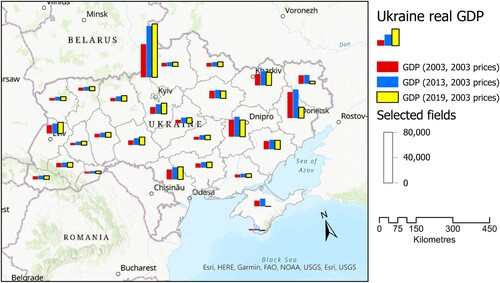
Figure 7. Ukrainian regional GDP, 2003–2019.
Notes: Data for Donetsk and Lugansk exclude the DPR and LNR. Estimates were derived from real GDP indices and 2003 real GDP in Ukrainian Kryvnia UAH).
Source: Elaborated from State Statistics Service of Ukraine, Citation2022. http://www.ukrstat.gov.ua/.