Figures & data
Scheme. 1. Synthesis of BET for electrochemical polymerisation
Fig. 1. POM images. (Top) CLC electrolyte solution containing HMSBT as a monomer (before polymerisation). (Bottom) CLC electrolyte solution after the electrochemical polymerisation.
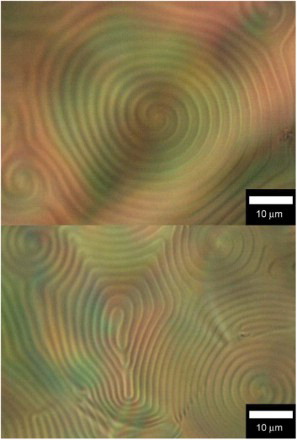
Table 1 Chemical structures of the monomers, the nematic LC, the chiral inducer, and the supporting electrolyte.
Fig. 2. POM images. (Top) CLC electrolyte solution containing BET as a monomer (before polymerisation). (Bottom) CLC electrolyte solution after the electrochemical polymerisation.
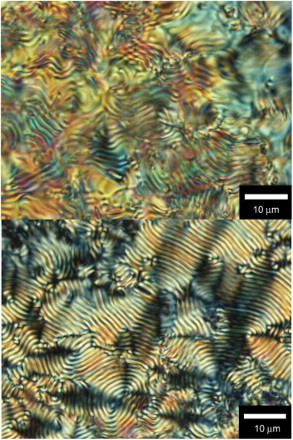
Fig. 3. POM image of the polymer film prepared in the CLC electrolyte solution. (Top) poly HMSBT, (bottom) poly BET.
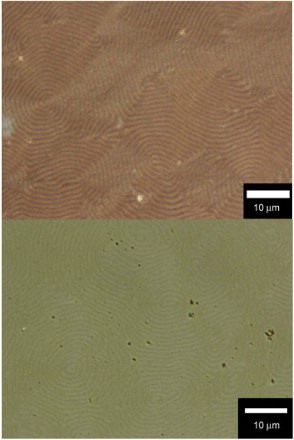
Fig. 4. (Top) CD spectra of the polymer at 0–0.7 V. (Bottom) UV–VIS absorption spectra of poly HMSBT at 0–0.7 V.
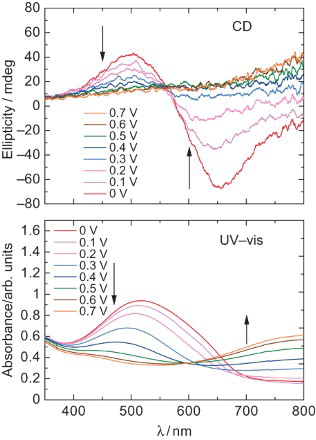
Fig. 5. Repeating change in ellipticity at 500 nm (top) and 650 nm (bottom) of poly HMSBT by applying voltage between 0 and 0.7 V.
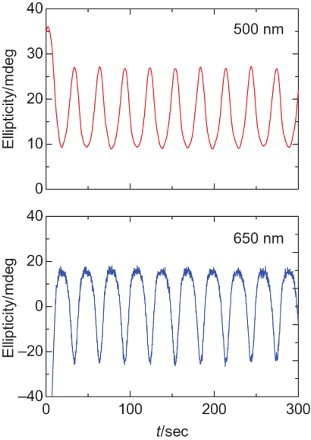
Fig. 6. UV–VIS absorption spectra of poly BET of as prepared form (doped) and reduced form.
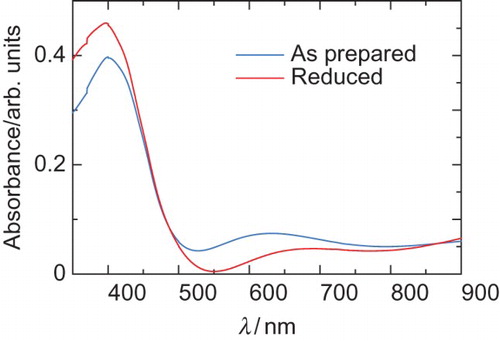
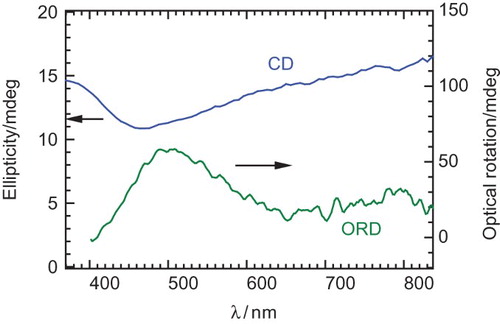
Fig. 7. CD and ORD of the poly BET prepared in CLC electrolyte solution.