
Figures & data
Figure 1. Survey area and location of respondents’ home.
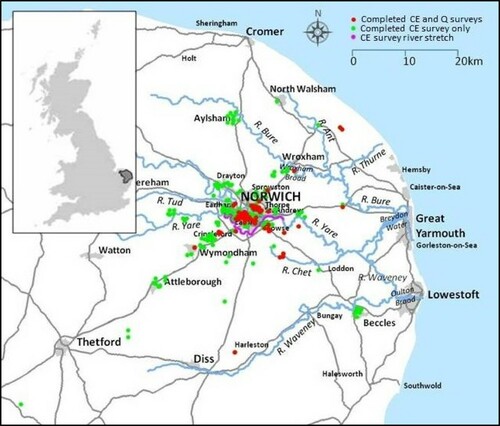
Table 1. Matrix of themes and statement typology.
Figure 2. Sorting grid configuration.
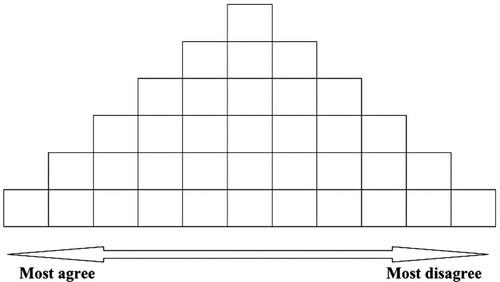
Table 2. Summary statistics of full sample and respondents’ groups.
Figure 3. CE attributes and levels.
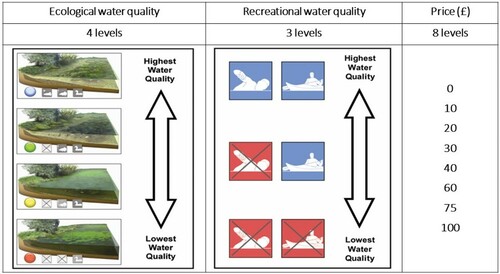
Table 3. Results of first order analyses.
Table 4. Meta-analysis factor array composition.
Table 5. Summary statistics for meta-analysis respondents.
Table 6. Factor Q-sort values for each statement within the meta-analysis.
Table 7. Q Narrative summaries.
Table 8. Correlations between factors scores in the meta-analysis.
Table 9. CL model of Q respondents’ water quality preferences.