
Figures & data
Figure 1. Kruger National Park. Source: https://www.safarinow.com/destinations/kruger-national-park/articles/kruger-national-park-map.aspx
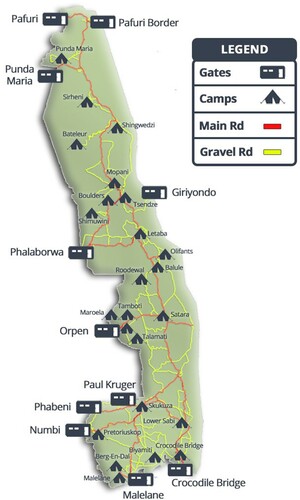
Table 1. Responses to bids (n = 377).
Table 2. Descriptive statistics (n = 377).
Table 3. Estimates of probit regression coefficients and mean and median willingness to pay (WTP) derived from the coefficients.
Table 4. Estimated revenue effects.
Table A1. Estimates of probit regression coefficients and mean willingness to pay (WTP) derived from the coefficients.