
Figures & data
Figure 1. The data structure.
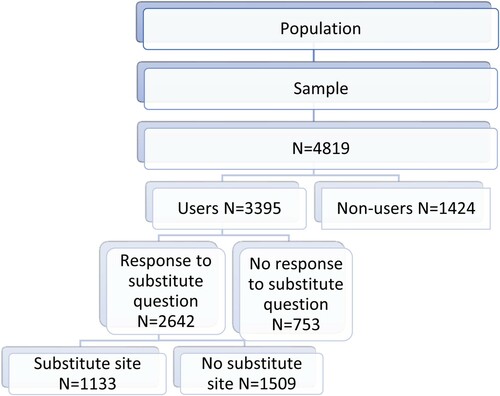
Table 1. Descriptive statistics for the variables in the logit and negbin models.
Table 2. Logistic regression model for the existence of substitute sites (dependent variable = 1 if the respondent had a substitute site for Baltic Sea recreation).
Table 3. Model 1 - TC model without substitutes (dependent variable = number of recreation visits to the Baltic Sea per year).
Table 4. Model 2 - TC model with substitute dummy (dependent variable = number of recreation visits to the Baltic Sea per year).
Table 5. Model 3 - TC model with substitute dummy and travel cost - substitute interaction (TC*Substitute) (dependent variable = number of recreation visits to the Baltic Sea per year).
Table 6. Consumer surplus estimates and predicted number of visits for recreation on the Baltic Sea coast (CS estimates are in PPP adjusted 2017 euros).