Figures & data
Figure 1. The Ratio of Female to Male Labor Force Participation Rate in Hong Kong Population Aged 25–54, GHS 1985–2020.
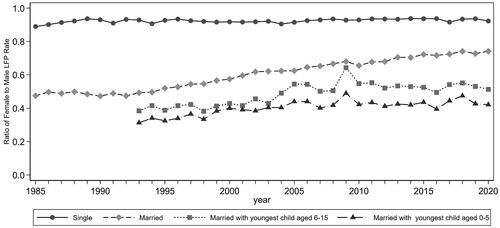
Table 1. Descriptive statistics for selected variables by the developmental stage of the youngest child, HKPSSD 2011–2018.
Table 2. Logit/Tobit Models Predicting the Effect of Childrearing on Women’s Labor Supply, HKPSSD 2011–2018.
Table 3. Logit/Tobit Models Predicting the Buffering Effect of Childcare Providers on Improving Mothers’ Labor Supply, HKPSSD 2011–2018.
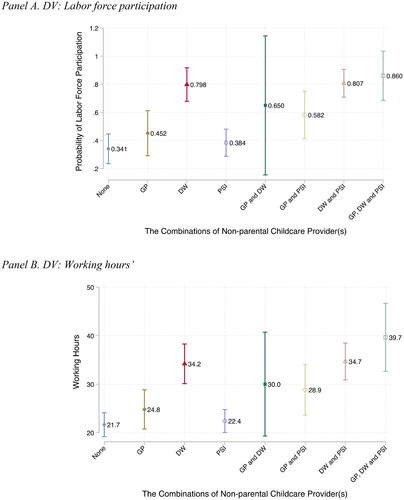
Figure 2. The Buffering Effect of Various Combinations of Childcare Provider(s) on Improving Mothers’ Labor Supply, HKPSSD 2011–2018.
Panel A. DV: Labor force participation.
Notes: Results are predicted from Model 3, .
Panel B. DV: Working hours.
Notes: Results are predicted from Model 6, .
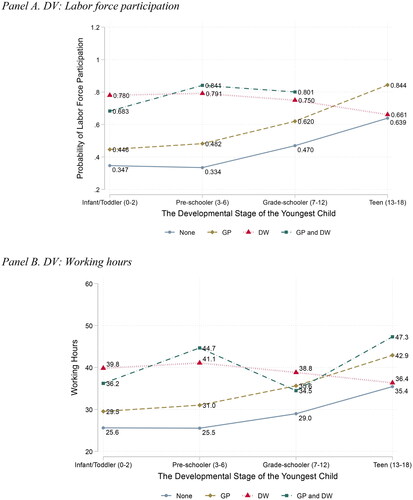
Table 4. Models Predicting the Buffering Effect of Complementary Childcare Providers to Improve Mothers’ Labor Supply, Mothers with Children Aged 0–6, HKPSSD 2011–2018.
Figure 3. The Buffering Effect of Complementary Childcare Provider(s) on Improving Mothers’ Labor Supply.
Panel A. DV: Labor force participation.
Notes: Results are predicted from Model 1, .
Panel B. DV: Working hours'
Notes: Results are predicted from Model 2, .