1,190
Views
7
CrossRef citations to date
0
Altmetric
Reviews

Assessing the potential for tertiary nitrification in sub-surface flow constructed wetlands

, , , &
Pages 68-77 | Received 01 Oct 2015, Accepted 08 May 2016, Published online: 10 Jun 2016

Figures & data

Figure 1. Common methods of air delivery to wastewater: (a) Falling films; (b) rising bubbles (non-media system) and (c) rising bubbles (media system).

Figure 1. Common methods of air delivery to wastewater: (a) Falling films; (b) rising bubbles (non-media system) and (c) rising bubbles (media system).

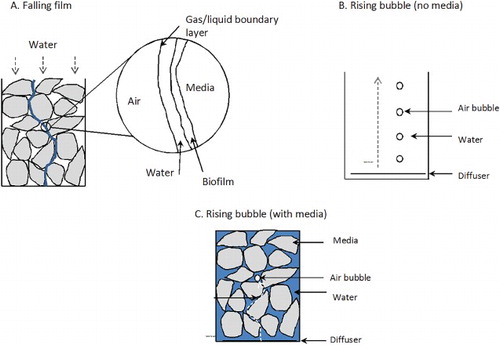
Table 1. Comparison of nitrification rates (NR) in various wetland systems at full and pilot scale.

Figure 2. Comparison of nitrification rates calculated for various full scale wetland systems. The ‘box’ represents the 50th percentile range, the line the median and the ‘whiskers’ the upper 5th and 95th percentiles.

Figure 2. Comparison of nitrification rates calculated for various full scale wetland systems. The ‘box’ represents the 50th percentile range, the line the median and the ‘whiskers’ the upper 5th and 95th percentiles.

Figure 3. Relationship between nitrification rate and NH4-N loading rate from long- and short-term performance data from full scale HF CWs, and full scale aerated and VF. All NRs and loading rates relate to data from the full scale studies taken reported in Table 2. HF systems older than 2 years old are considered established. All other data points are from full scale systems less than 2 years old plotted up to loading rates of a maximum of 9 gNH4 m−2 d−1.

Figure 3. Relationship between nitrification rate and NH4-N loading rate from long- and short-term performance data from full scale HF CWs, and full scale aerated and VF. All NRs and loading rates relate to data from the full scale studies taken reported in Table 2. HF systems older than 2 years old are considered established. All other data points are from full scale systems less than 2 years old plotted up to loading rates of a maximum of 9 gNH4 m−2 d−1.