
Figures & data

Figure 1. Optimum range of the DO/TAN ratio and corresponding nitrite accumulation ratio reported in the literature.
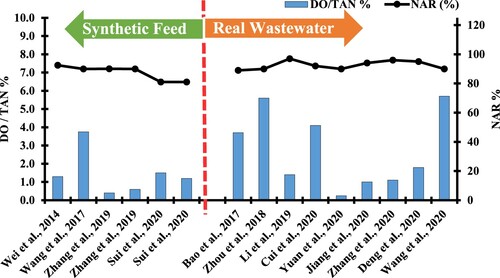
Table 1. Performance of PN in real and synthetic wastewater-based reactor systems using pH as an operational strategy.
Table 2. Performance of PN in real and synthetic wastewater-based reactor systems using Temperature as operational strategy.
Figure 2. Optimum range of SRT and corresponding nitrite accumulation percentages reported in literature.
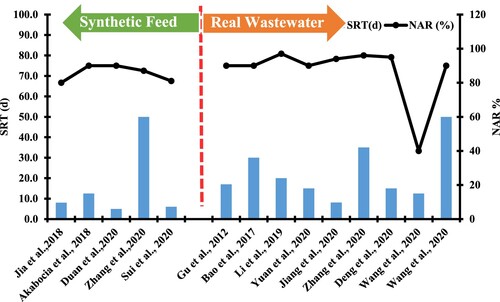
Table 3. Performance of PN in real and synthetic wastewater-based reactor systems using FNA and FA operational strategies.
Table 4. Performance of PN in real and synthetic wastewater-based reactor systems using other operational strategy.
Data availability statement
All data and information are mentioned in the manuscript.