Figures & data
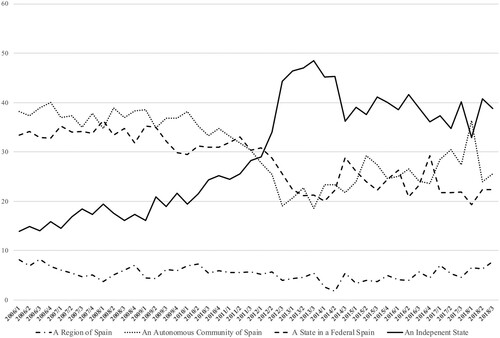
Figure 1. Institutional preferences (%) in Catalonia, 2006–18.
Source: Based on data from the Centre d’Estudis d’Opinió (http://ceo.gencat.cat/ca/barometre/?pagina=1).
A chart demonstrating the development of public opinion in Catalonia between 2006 and 2018, with four preferences stated: a region of Spain; an Autonomous Community of Spain; a state in a federal Spain; an independent State. The chart shows a gradual increase in support for independent State from 2006 to 2012 from about 15 to about 30%; a rapid increase in support for independent state from 2012 to 2013 from 30 to almost 50%, and stagnation thereafter at around 40%.