Figures & data
Figure 1. Flowchart participant selection. Note. CBCL = Child Behavior Checklist.
Table 1. Child and maternal characteristics (n = 853).
Figure 3. Illustration of nonlinear age associations. Presented are unstandardized regression coefficients (Bs) and confidence intervals, with the oldest age group used as the reference category. Analyses were adjusted for child gender and ethnicity. *p < .05. **p < .01. ***p < .001.
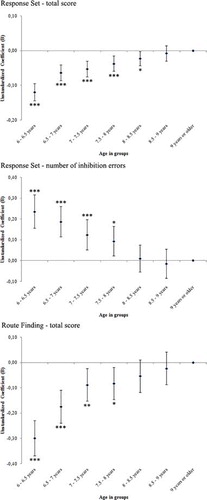
Table 2. The association of age with NEPSY-II-NL task performance.
Table 3. The association of gender with NEPSY-II-NL task performance.
Table 4. The association of intelligence with NEPSY-II-NL task performance.
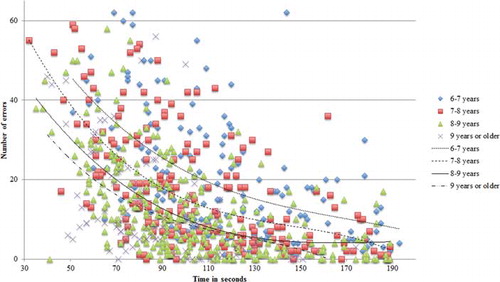
Figure 4. Scatterplot of number of errors and time for the Visuomotor Precision task. Reduced n = 746 (outliers ± 2 standard deviations from the mean were excluded). Fit lines are polynomials.