Figures & data
Table 1. Age, IQ, and neuropsychological test scores.
Table 2. Diagnoses ADHD, medication, and scores on DBD according to teachers and parents.
Table 3. Explanation scoring possibilities observation form off-task behavior.
Figure 1. Procedure for every week during the study.
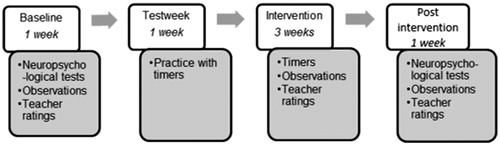
Figure 2. Percentage off-task behavior per time period by observations (raw data points are in Figure A1 of Appendix A).
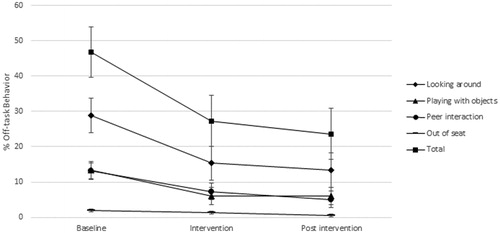
Table 4 . Means, standard deviations, and GLM-repeated measures test results of observations of off-task behavior (in %) and teacher ratings of on-task behavior (score 1–5)1.
Figure 3. Teacher ratings of on-task behavior for all students per time period.
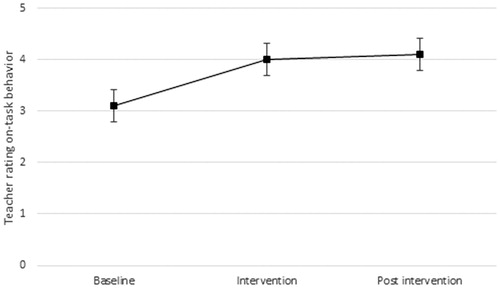
Table 5. Pre–post comparisons of neuropsychological test scores.
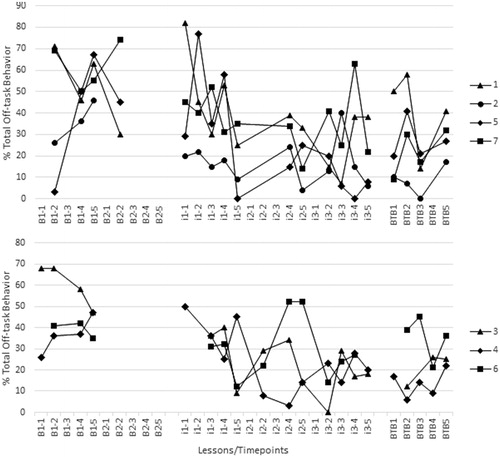
Figure A1. Percentage off-task behavior per time point per student by observations, divided by classroom (B: Baseline, i: intervention, Pi: Post intervention).