757
Views
1
CrossRef citations to date
0
Altmetric
Research Paper

Macro fat and micro fat: insulin sensitivity and gender dependent response of adipose tissue to isocaloric diet change

, , , &
Pages 256-263 | Received 05 Jan 2015, Accepted 02 Feb 2015, Published online: 21 Apr 2015

Figures & data

Table 1. Comparison of cell-size distribution variable of each subject group at basal conditions

Table 2. Relative difference of cell-size distribution characteristics

Figure 1. Estimated parameter at specific diet composition (CI, %) (A, B) Turnover rate coefficient “D” distinguished by (A) ISM, ISF, IRM, IRF; (B) by the average values of all male or female; (C, D) Growth/shrinkage coefficient “Vm” distinguished (C) by ISM, ISF, IRM, IRF; (D) by average values of all male or female, which is calculated as the mean value of all male or all female subject based on the estimated parameter for ISM- IRM, ISF- IRF.
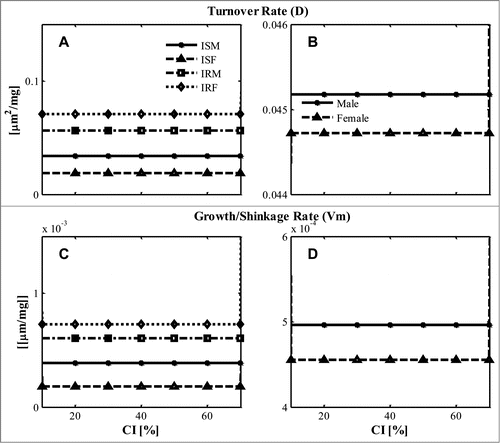
Figure 1. Estimated parameter at specific diet composition (CI, %) (A, B) Turnover rate coefficient “D” distinguished by (A) ISM, ISF, IRM, IRF; (B) by the average values of all male or female; (C, D) Growth/shrinkage coefficient “Vm” distinguished (C) by ISM, ISF, IRM, IRF; (D) by average values of all male or female, which is calculated as the mean value of all male or all female subject based on the estimated parameter for ISM- IRM, ISF- IRF.

Figure 2. Representative changes of adipose cell-size distribution time courses with specific diet composition (A) CI = 10%; (B) CI = 40%; (C) CI = 60%; (D) CI = 70%. The changes are calculated as the difference between the cell-size distribution at specific time n(s,tj) and the initial cell-size distribution n(s,t0). The results of different simulation time are compared: dashed line, 4 days; dotted line, 9 days; dash-dot line, 14 days. (One of the ISF subjects is shown here.)
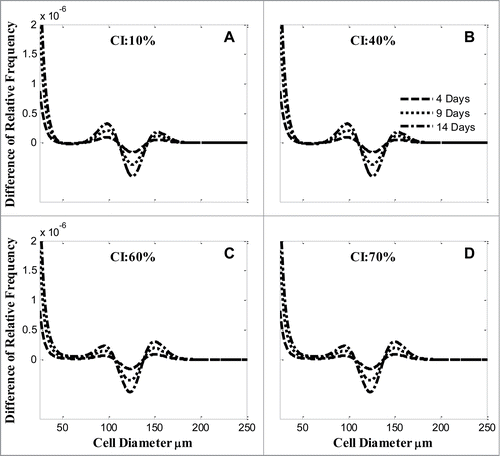
Figure 2. Representative changes of adipose cell-size distribution time courses with specific diet composition (A) CI = 10%; (B) CI = 40%; (C) CI = 60%; (D) CI = 70%. The changes are calculated as the difference between the cell-size distribution at specific time n(s,tj) and the initial cell-size distribution n(s,t0). The results of different simulation time are compared: dashed line, 4 days; dotted line, 9 days; dash-dot line, 14 days. (One of the ISF subjects is shown here.)

Figure 3. Average changes of adipose cell-size distribution (relative frequency) after 2 weeks for all male or all female subjects with diet composition (A) CI = 10% or (B) CI = 70%. Two models simulations are compared. Solid line, male from MOD 1; dashed line, female from MOD 1; dash-dot line, male from MOD 2; dotted line, female from MOD 2.
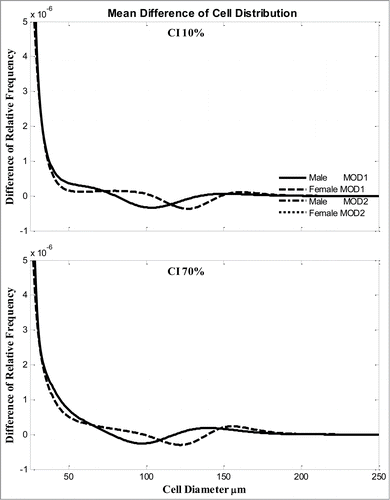
Figure 3. Average changes of adipose cell-size distribution (relative frequency) after 2 weeks for all male or all female subjects with diet composition (A) CI = 10% or (B) CI = 70%. Two models simulations are compared. Solid line, male from MOD 1; dashed line, female from MOD 1; dash-dot line, male from MOD 2; dotted line, female from MOD 2.
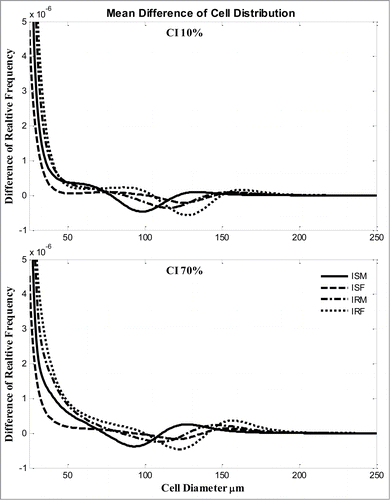
Figure 4. Average changes of adipose cell-size distribution (relative frequency) after 2 weeks for ISM, ISF, IRM, IRF subjects with diet composition (A) CI = 10% or (B) CI 70%. Solid line, ISM; dashed line, ISF; dash-dot line, IRM, dotted line, IRF.

Figure 4. Average changes of adipose cell-size distribution (relative frequency) after 2 weeks for ISM, ISF, IRM, IRF subjects with diet composition (A) CI = 10% or (B) CI 70%. Solid line, ISM; dashed line, ISF; dash-dot line, IRM, dotted line, IRF.
Supplemental material

Supplemental_Materials.docx

Download MS Word (144.5 KB)

Reprints and Corporate Permissions

Please note: Selecting permissions does not provide access to the full text of the article, please see our help page How do I view content?

To request a reprint or corporate permissions for this article, please click on the relevant link below:

Academic Permissions

Please note: Selecting permissions does not provide access to the full text of the article, please see our help page How do I view content?

Obtain permissions instantly via Rightslink by clicking on the button below:

If you are unable to obtain permissions via Rightslink, please complete and submit this Permissions form. For more information, please visit our Permissions help page.