513
Views
2
CrossRef citations to date
0
Altmetric
Research Paper

ClipR-59 plays a critical role in the regulation of body glucose homeostasis

&
Pages 286-294 | Received 06 Mar 2015, Accepted 28 Apr 2015, Published online: 19 Jun 2015

Figures & data

Figure 1. Generation of ClipR-59 transgenic mice. (a) Diagram of the Ap2-ClipR-59 transgene, which contains a Flag-tagged and a 150bp CREB 5’ UTR. (b) PCR analysis of tail DNA by ClipR-59-specific primers reveals that mice 84 and 85 harbor the transgenic gene (left bottom panel). The right bottom panel shows the PCR product of mouse 85's tail genomic DNA digested with EcoRI (ClipR-59). Note: The PCR product of ClipR-59 contains an EcoRI restriction site which gives 100bp and 150bp fragments following EcoRI digestion. (c) Genotype of the F1 generation of ClipR-59 transgenic mice. (d) Expression of the ClipR-59 transgenic gene in transgenic and wildtype mice. Total RNA were prepared from Fat (F), liver (L) and Kidney (K) from wildtype and ClipR-59 transgenic mice and its wildtype littermates and subjected to RT-PCR.
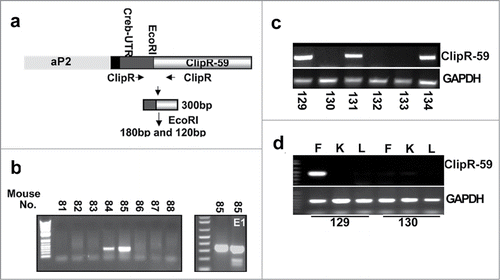
Figure 1. Generation of ClipR-59 transgenic mice. (a) Diagram of the Ap2-ClipR-59 transgene, which contains a Flag-tagged and a 150bp CREB 5’ UTR. (b) PCR analysis of tail DNA by ClipR-59-specific primers reveals that mice 84 and 85 harbor the transgenic gene (left bottom panel). The right bottom panel shows the PCR product of mouse 85's tail genomic DNA digested with EcoRI (ClipR-59). Note: The PCR product of ClipR-59 contains an EcoRI restriction site which gives 100bp and 150bp fragments following EcoRI digestion. (c) Genotype of the F1 generation of ClipR-59 transgenic mice. (d) Expression of the ClipR-59 transgenic gene in transgenic and wildtype mice. Total RNA were prepared from Fat (F), liver (L) and Kidney (K) from wildtype and ClipR-59 transgenic mice and its wildtype littermates and subjected to RT-PCR.

Figure 2. Characterization of ClipR-59 transgenic mice. (a) Growth rates of ClipR-59 transgenic mice and their wildtype littermates (n = 6). (b) Fast glucose blood levels of ClipR-59 transgenic mice (TG) and their wildtype littermates. The bar graph shows means ± STDV, n =6. P < 0.05. (c) Glucose tolerance of wildtype and ClipR-59 transgenic mice (n = 6). (d) Insulin tolerance assay of wildtype and ClipR-59 transgenic mice (n = 6).The error bar shows ± STDV (n = 6).
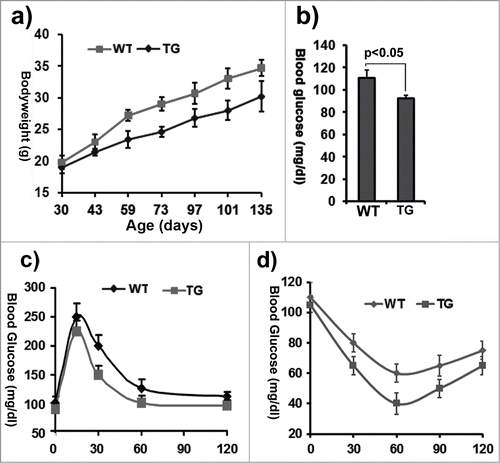
Figure 2. Characterization of ClipR-59 transgenic mice. (a) Growth rates of ClipR-59 transgenic mice and their wildtype littermates (n = 6). (b) Fast glucose blood levels of ClipR-59 transgenic mice (TG) and their wildtype littermates. The bar graph shows means ± STDV, n =6. P < 0.05. (c) Glucose tolerance of wildtype and ClipR-59 transgenic mice (n = 6). (d) Insulin tolerance assay of wildtype and ClipR-59 transgenic mice (n = 6).The error bar shows ± STDV (n = 6).

Figure 3. The impact of ClipR-59 expression on adipose growth. (a) The appearance of male control (WT) and ClipR-59 transgenic (TG) mice. (b) The ratio of epididymal pad mass and bodyweight. The bar graph shows means ± STDV, n = 6. P < 0.04. (c) H&E staining of white adipose tissues of wildtype and ClipR-59 transgenic mice shows reduced adipocyte size in ClipR-59 transgenic mice. Only representative tissues were presented. (d) ClipR-59 transgenic mice on high calorie diet. ClipR-59 adipose transgenic (TG) and wildtype male mice (6 per group) at age of 4 weeks were feed with regular chow or high calorie diet (HD) were feed for 12 weeks. The bodyweights were measured for every 7-10 days. The bar graph shows means ± STDV, n = 6.
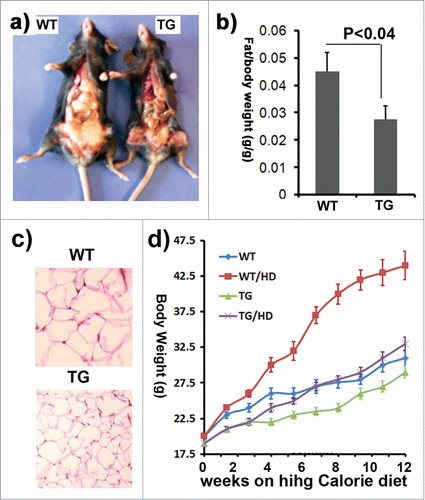
Figure 3. The impact of ClipR-59 expression on adipose growth. (a) The appearance of male control (WT) and ClipR-59 transgenic (TG) mice. (b) The ratio of epididymal pad mass and bodyweight. The bar graph shows means ± STDV, n = 6. P < 0.04. (c) H&E staining of white adipose tissues of wildtype and ClipR-59 transgenic mice shows reduced adipocyte size in ClipR-59 transgenic mice. Only representative tissues were presented. (d) ClipR-59 transgenic mice on high calorie diet. ClipR-59 adipose transgenic (TG) and wildtype male mice (6 per group) at age of 4 weeks were feed with regular chow or high calorie diet (HD) were feed for 12 weeks. The bodyweights were measured for every 7-10 days. The bar graph shows means ± STDV, n = 6.

Figure 4. Subcellular fractionation assays of adipocytes from wildtype and ClipR-59 transgenic mice. (a) Adipocytes were prepared from epididymal pads from either wildtype or ClipR-59 transgenic mice. Then, the adipocytes were treated with or without 10nM insulin and plasma membrane were prepared as described in Methods and Materials. The plasma membrane fractions were analyzed in Western Blot with Anti-Glut4, anti-IRAP, anti-phospho-Akt, anti-Akt and anti-syntaxin 4 (stx4) antibodies, respective as indicated. PM: plasma membrane. Tcl: total cell lystates. (b) Quantification of Glut4 membrane translocation in (a). The Glut4 levels in PM in wildtype adipocytes without insulin simulation were set as 1 after normalized to the levels of syntaxin 4 on PM. Bar graphs show means ± STDV, n = 3.
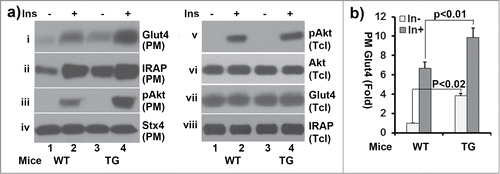
Figure 4. Subcellular fractionation assays of adipocytes from wildtype and ClipR-59 transgenic mice. (a) Adipocytes were prepared from epididymal pads from either wildtype or ClipR-59 transgenic mice. Then, the adipocytes were treated with or without 10nM insulin and plasma membrane were prepared as described in Methods and Materials. The plasma membrane fractions were analyzed in Western Blot with Anti-Glut4, anti-IRAP, anti-phospho-Akt, anti-Akt and anti-syntaxin 4 (stx4) antibodies, respective as indicated. PM: plasma membrane. Tcl: total cell lystates. (b) Quantification of Glut4 membrane translocation in (a). The Glut4 levels in PM in wildtype adipocytes without insulin simulation were set as 1 after normalized to the levels of syntaxin 4 on PM. Bar graphs show means ± STDV, n = 3.

Figure 5. The impact of ClipR-59 expression on adiponectin production. (a) ClipR-59 transgenic adipose show increased adiponectin production. Epididymal pads were isolated from ClipR-59 transgenic mice and their wildtype littermates and incubated in serum-free medium for 6 hrs. Then medium and total tissue extracts were harvested for Western Blot with indicated antibody. (b) Quantitative presentation of Data in a). The medium levels of adiponectin in wildtype adipose tissue were set as 100%. Bar graphs show means ± STDV, n = 6. (c) Overexpression of ClipR-59 in 3T3-L1 adipocytes increases adiponectin production. 3T3-L1 adipocytes were transduced with adenoviral vectors that express either GFP or ClipR-59 in triplicates. 48h posttransduction, the medium was changed to serum free medium. 6 hrs later, the medium and total cell lysates were harvested for Western blot with anti-adiponectin antibody (i) and (ii). The levels of Flag-ClipR-59 expressed from adenoviral vectors is shown in panel iii. (d) Quantitative presentation of Data in a). The medium levels of adiponectin in control medium were set as 100%. Bar graphs show means ± STDV, n = 3. (e and f) Knockdown of ClipR-59 in adipocytes reduces adiponectin production. The experiments were carried out similar to (c) and (d) except adenoviral vectors that express either luciferase shRNA or ClipR-59 shRNA were used. Med: Medium. Cell: cell lysates.
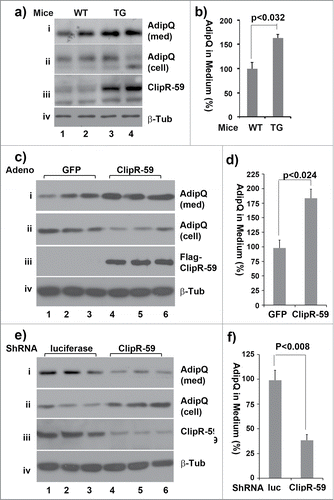
Figure 5. The impact of ClipR-59 expression on adiponectin production. (a) ClipR-59 transgenic adipose show increased adiponectin production. Epididymal pads were isolated from ClipR-59 transgenic mice and their wildtype littermates and incubated in serum-free medium for 6 hrs. Then medium and total tissue extracts were harvested for Western Blot with indicated antibody. (b) Quantitative presentation of Data in a). The medium levels of adiponectin in wildtype adipose tissue were set as 100%. Bar graphs show means ± STDV, n = 6. (c) Overexpression of ClipR-59 in 3T3-L1 adipocytes increases adiponectin production. 3T3-L1 adipocytes were transduced with adenoviral vectors that express either GFP or ClipR-59 in triplicates. 48h posttransduction, the medium was changed to serum free medium. 6 hrs later, the medium and total cell lysates were harvested for Western blot with anti-adiponectin antibody (i) and (ii). The levels of Flag-ClipR-59 expressed from adenoviral vectors is shown in panel iii. (d) Quantitative presentation of Data in a). The medium levels of adiponectin in control medium were set as 100%. Bar graphs show means ± STDV, n = 3. (e and f) Knockdown of ClipR-59 in adipocytes reduces adiponectin production. The experiments were carried out similar to (c) and (d) except adenoviral vectors that express either luciferase shRNA or ClipR-59 shRNA were used. Med: Medium. Cell: cell lysates.

Figure 6. ClipR-59 transgenic mice show increased circulating adiponectin. (a) Western Blot analysis of plasma sera from 3-month old wildtype (WT) and ClipR-59 adipose transgenic mice (TG) fasted for 6 hours. 50ug of total plasma sera were separated on SDS page and probed with anti-adiponectin antibody. (b). Quantification of Western Blot in a). The plasma levels of adiponectin from wildtype mice were set as 1. Bar graphs show means ± STDV, n = 3. *P < 0.005. (c) Western Blot analysis of plasma sera from wildtype (WT) and ClipR-59 adipose transgenic mice (TG) under regular chow (RC) and high calorie diet (HD) for 12 weeks with anti-adiponectin antibody. (d) Quantification of Western Blot in (a). The plasma levels of adiponectin from wildtype mice under normal chow were set as 1. Bar graphs show means ± STDV, n = 3. *P < 0.042. **P < 0.002. (e) Western blot of analysis of tissue (adipose: adipo and skeletal muscle) extracts from wildtype (WT) and ClipR-59 adipose transgenic (TG) with anti-phospho-AMPKα at Thr172 (i and iii), anti-AMPKα (ii and iv) and anti-ClipR-59 (v) antibodies, respectively. (f) Quantification of adipose tissue pAMPKα in (e). The levels of pAMPKα in wildtype mice were set as 1 after normalized to total level of AMPKα. Bar graphs show means ± STDV, n = 3. *P < 0.043. (g) Quantification of muscle pAMPKα in (e). The levels of pAMPKα in wildtype mice were set as 1 after normalized to total level of AMPKα. *P < 0.0082. (h) RT-PCR analysis of the expression of PGC1a, ACC1, FASN, SREBP1c and ClipR-59 in ClipR-59 transgenic adipose tissue. Bar graphs show means ± STDV, n = 3. *P < 0.002, ** P < 0.03.
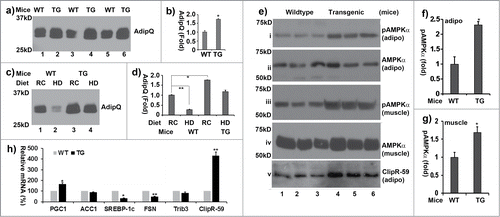
Figure 6. ClipR-59 transgenic mice show increased circulating adiponectin. (a) Western Blot analysis of plasma sera from 3-month old wildtype (WT) and ClipR-59 adipose transgenic mice (TG) fasted for 6 hours. 50ug of total plasma sera were separated on SDS page and probed with anti-adiponectin antibody. (b). Quantification of Western Blot in a). The plasma levels of adiponectin from wildtype mice were set as 1. Bar graphs show means ± STDV, n = 3. *P < 0.005. (c) Western Blot analysis of plasma sera from wildtype (WT) and ClipR-59 adipose transgenic mice (TG) under regular chow (RC) and high calorie diet (HD) for 12 weeks with anti-adiponectin antibody. (d) Quantification of Western Blot in (a). The plasma levels of adiponectin from wildtype mice under normal chow were set as 1. Bar graphs show means ± STDV, n = 3. *P < 0.042. **P < 0.002. (e) Western blot of analysis of tissue (adipose: adipo and skeletal muscle) extracts from wildtype (WT) and ClipR-59 adipose transgenic (TG) with anti-phospho-AMPKα at Thr172 (i and iii), anti-AMPKα (ii and iv) and anti-ClipR-59 (v) antibodies, respectively. (f) Quantification of adipose tissue pAMPKα in (e). The levels of pAMPKα in wildtype mice were set as 1 after normalized to total level of AMPKα. Bar graphs show means ± STDV, n = 3. *P < 0.043. (g) Quantification of muscle pAMPKα in (e). The levels of pAMPKα in wildtype mice were set as 1 after normalized to total level of AMPKα. *P < 0.0082. (h) RT-PCR analysis of the expression of PGC1a, ACC1, FASN, SREBP1c and ClipR-59 in ClipR-59 transgenic adipose tissue. Bar graphs show means ± STDV, n = 3. *P < 0.002, ** P < 0.03.

Reprints and Corporate Permissions

Please note: Selecting permissions does not provide access to the full text of the article, please see our help page How do I view content?

To request a reprint or corporate permissions for this article, please click on the relevant link below:

Academic Permissions

Please note: Selecting permissions does not provide access to the full text of the article, please see our help page How do I view content?

Obtain permissions instantly via Rightslink by clicking on the button below:

If you are unable to obtain permissions via Rightslink, please complete and submit this Permissions form. For more information, please visit our Permissions help page.