Figures & data
Figure 1. Experimental design. Two approaches were designed to determine the effects of high glucose concentration on the regulation of Cav-1 expression and its relation to the insulin signaling pathway during adipocyte differentiation and in mature adipocytes. For the first objective, 3T3-L1 preadipocytes were differentiated during 21 days in the presence of 25 mM extra-glucose. Checkpoints were established at days 0, 7 and 21 of this process. As a second method, 7-day mature 3T3-L1 adipocytes were incubated with 25 mM extra-glucose for 48 hours. Control points were set up at days 7 and 9. Genomic DNA, total RNA and total proteins were extracted at every checkpoint to carry out further determinations.
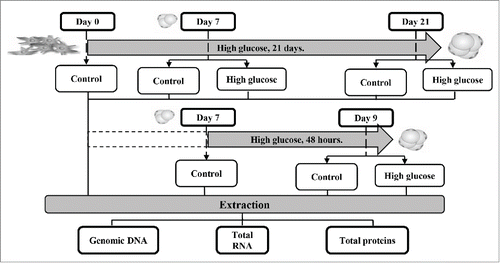
Figure 2. Effects of high glucose on secreted leptin and adiponectin levels during 3T3-L1 differentiation and in 3T3-L1 mature adipocytes. Culture medium samples of (A, C) 3T3-L1 preadipocytes (d0) and control /glucose-exposed (50 mM) adipocytes (d7, d21) and of (B, D) Control (d7, d9)/glucose-exposed (50 mM, 48 hours) 3T3-L1 adipocytes (d9) were obtained for adipokine ELISA assays. Data are means ± SEM of the concentration of each adipokine secreted to the cell medium. Groups were compared by using the ANOVA for a single factor and Dunnett's test. (A, C) Data from control groups are compared to day 0 *. p < 0.05; **. p < 0.01 or to day 7 Δ. p < 0.05. Glucose-exposed cells are compared to the control group from the same differentiation day +. p < 0.05. (B, D) Data from control cells at day 9 were compared to control cells at day 7 **. p < 0.01. Data from glucose-exposed cells were compared to their same day control group +. p < 0.05. The number of independent samples analyzed is ≥10 for each adipokine and condition evaluated.
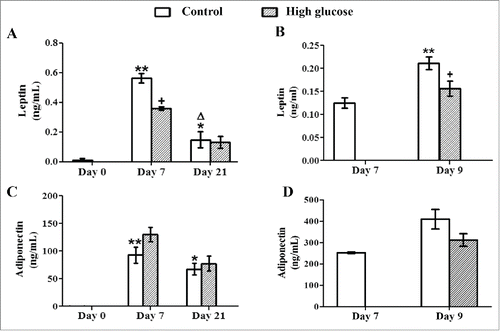
Figure 3. Effects of high glucose on cell differentiation and triglyceride storage during 3T3-L1 differentiation and in 3T3-L1 mature adipocytes. (A) 3T3-L1 preadipocytes (d0) and control /glucose-exposed (50 mM) adipocytes (d7, d21) and (B) Control (d7, d9)/glucose-exposed (50 mM, 48 hours) 3T3-L1 adipocytes (d9) were photographed using a light microscope (40X magnification). (C) Intracelullar triglycerides quantification of the preadipocytes (d0) and control /glucose-exposed (50 mM) adipocytes (d7, d21) and (D) of the control (d7, d9)/glucose-exposed (50 mM, 48 hours) 3T3-L1 adipocytes (d9) using Oil Red O Staining. Data are means ± SEM of dye OD at 540 nm. (C) Data from control groups are compared to day 0**.p < 0.01 and glucose-exposed groups are compared to the control groups from the same differentiation day ++. p < 0.01. (D) Data from control group are compared to day 7**.p < 0.01 and from glucose-exposed group are compared to the control group of the same differentiation day ++. p < 0.01 .The number of independent samples analyzed is ≥10 for each day and condition evaluated.
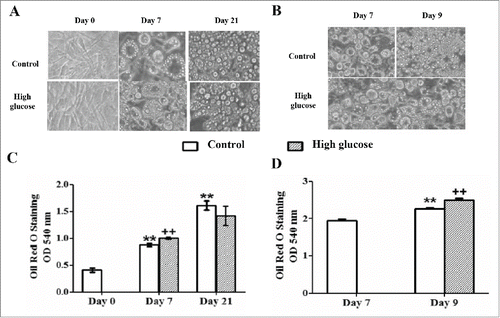
Figure 4. Methylation levels of CpG dinucleotides located in the caveolin-1 promoter, exon 1 and intron 1 in 3T3-L1 long-term differentiated adipocytes exposed or not to high glucose during the differentiation process. The methylation levels of 70 CpG sites in caveolin-1 promoter, exon 1 and intron 1 were compared in control /glucose-exposed (50 mM) 3T3-L1 long-term differentiated adipocytes at day 21. MassARRAY system was used for the quantitative methylation analysis. (A) CpG 1 to 38 (B) CpG 39 to 70 of the sequence under study. Data are means ± SEM of the methylation percentage of each CpG dinucleotide specified in the figure. Groups were compared by using the Mann-Whitney U test. Significant differences between control and glucose-exposed cells +. p < 0.05. Gene structure is schematized over the graphs indicating the Transcription Start Site (TSS) and the initiation codon (ATG) position. The number of independent samples analyzed is between 5–8, measured in triplicate for each CpG dinucleotide under study.
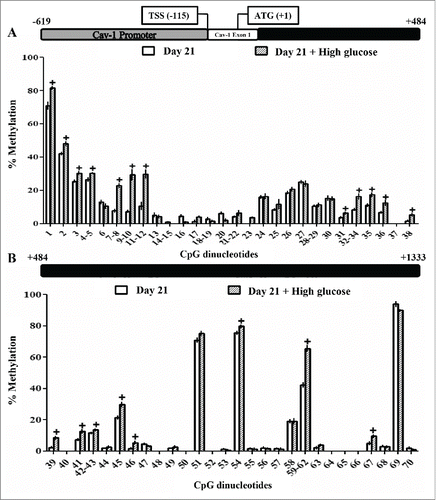
Figure 5. Methylation levels of CpG dinucleotides in the caveolin-1 promoter, exon 1 and intron 1 in 3T3-L1 mature adipocytes exposed or not to high glucose during 48 hours. The methylation levels of 70 CpG sites in caveolin-1 promoter, exon 1 and intron 1 were compared in control (d7)/glucose-exposed (50 mM, 48 hours), 3T3-L1 mature adipocytes (d9). MassARRAY system was used for the quantitative methylation analysis. (A) CpG 1 to 38 (B) CpG 39 to 70 of the sequence under study. Data are means ± SEM of the methylation percentage of each CpG dinucleotide specified in the figure. Groups were compared by using the Mann-Whitney U test. Significant differences between control day 7 and day 9 cells*. p < 0.05. Significant differences between control and glucose-exposed cells +. p < 0.05. Gene structure is schematized over the graphs indicating the Transcription Start Site (TSS) and the initiation codon (ATG) position. The number of independent samples analyzed is between 5–8, measured in triplicate for each CpG dinucleotide under study.
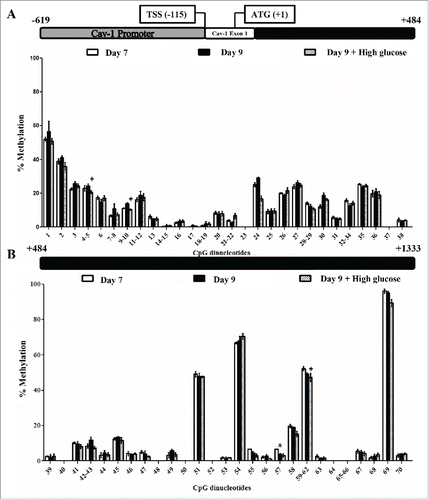
Figure 6. Caveolin-1 and insulin signaling intermediates expression during 3T3-L1 differentiation in the presence or in the absence of high glucose (50 mM). (A) mRNA levels. Data are means ± SEM of the ratio between each gene and cyclophilin expression at differentiation days 0, 7 and 21. Groups were compared by using the ANOVA for a single factor and Dunnett's test. (B) Protein levels. Data are means ± SEM of the ratio between each protein and β-actin expression at differentiation days 0, 7 and 21. Groups were compared by using the Wilcoxon signed-rank test. Data from control cells were compared to day 0 *. p < 0.05; **. p < 0.01. Data from glucose-exposed groups were compared to their same day control group +. p < 0.05; ++. p < 0.01. The number of independent samples analyzed for (A) is ≥10 for each determination and condition evaluated, whereas the number of independent samples analyzed for (B) is between 5–10 for each protein and condition evaluated.
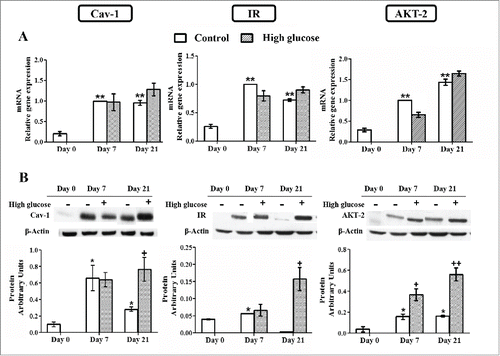
Figure 9. Effects of high glucose on glucose transporter type 4 (Glut-4) expression and deoxyglucose uptake during 3T3-L1 differentiation (A, C, E) and in 3T3-L1 mature adipocytes (B, D, F). Results from A, C and E correspond to preadipocytes (d0) and control /glucose-exposed (50 mM) adipocytes (d7,d21), whereas results from B, D and F correspond to control (d7, d9) /glucose-exposed (50 mM, 48 hours) adipocytes (d9). (A, B) mRNA levels. Data are means ± SEM of the ratio between Glut-4 and cyclophilin expression. Groups were compared by using the ANOVA for a single factor and Dunnett's test. (C, D) Protein levels. Data are means ± SEM of the ratio between Glut-4 and β-actin expression. Groups were compared by using the Wilcoxon signed-rank test. (E, F) Deoxyglucose uptake by control and glucose-exposed 3T3-L1 cells before and after insulin stimulation (50 nM, 10 min). Data are means ± SEM of 2-[C14]-deoxyglucose (in µmol) incorporated by cells after 10 minutes, adjusted by total protein in grams. Groups were compared by using the ANOVA for a single factor and Dunnett's test. (A, C, E) Data from control groups are referred to control day 0 **. p < 0.01 or to control day 7 ΔΔ. p < 0.01. Data from glucose-exposed groups were compared to their same day control group ++. p < 0.01. (E) Data from insulin-stimulated groups were compared to their unstimulated group, ΦΦ.p < 0.01. Data from insulin-stimulated glucose-exposed groups were compared to the same day insulin-stimulated control groups $$. p < 0.01. (B, D, F) Data from control groups at day 9 were compared to control cells at day 7 *. p < 0.05; **. p < 0.01. Data from glucose-exposed groups were compared to their same day control group ++. p < 0.01. (F) Data from insulin-stimulated groups were compared to their unstimulated group, ΦΦ. p < 0.01. Data from insulin-stimulated glucose-exposed groups were compared to the same day insulin-stimulated control groups $$. p < 0.01. The number of independent samples analyzed for (A), (B), (E) and (F) is ≥10 for each determination and condition evaluated whereas the number of independent samples analyzed for (C) and (D) is between 5 and 10 for each protein and condition evaluated.
![Figure 9. Effects of high glucose on glucose transporter type 4 (Glut-4) expression and deoxyglucose uptake during 3T3-L1 differentiation (A, C, E) and in 3T3-L1 mature adipocytes (B, D, F). Results from A, C and E correspond to preadipocytes (d0) and control /glucose-exposed (50 mM) adipocytes (d7,d21), whereas results from B, D and F correspond to control (d7, d9) /glucose-exposed (50 mM, 48 hours) adipocytes (d9). (A, B) mRNA levels. Data are means ± SEM of the ratio between Glut-4 and cyclophilin expression. Groups were compared by using the ANOVA for a single factor and Dunnett's test. (C, D) Protein levels. Data are means ± SEM of the ratio between Glut-4 and β-actin expression. Groups were compared by using the Wilcoxon signed-rank test. (E, F) Deoxyglucose uptake by control and glucose-exposed 3T3-L1 cells before and after insulin stimulation (50 nM, 10 min). Data are means ± SEM of 2-[C14]-deoxyglucose (in µmol) incorporated by cells after 10 minutes, adjusted by total protein in grams. Groups were compared by using the ANOVA for a single factor and Dunnett's test. (A, C, E) Data from control groups are referred to control day 0 **. p < 0.01 or to control day 7 ΔΔ. p < 0.01. Data from glucose-exposed groups were compared to their same day control group ++. p < 0.01. (E) Data from insulin-stimulated groups were compared to their unstimulated group, ΦΦ.p < 0.01. Data from insulin-stimulated glucose-exposed groups were compared to the same day insulin-stimulated control groups $$. p < 0.01. (B, D, F) Data from control groups at day 9 were compared to control cells at day 7 *. p < 0.05; **. p < 0.01. Data from glucose-exposed groups were compared to their same day control group ++. p < 0.01. (F) Data from insulin-stimulated groups were compared to their unstimulated group, ΦΦ. p < 0.01. Data from insulin-stimulated glucose-exposed groups were compared to the same day insulin-stimulated control groups $$. p < 0.01. The number of independent samples analyzed for (A), (B), (E) and (F) is ≥10 for each determination and condition evaluated whereas the number of independent samples analyzed for (C) and (D) is between 5 and 10 for each protein and condition evaluated.](/cms/asset/3c6cf06b-db4a-44a8-82d2-5f99e91d9078/kadi_a_1122856_f0009_b.gif)
Figure 7. Caveolin-1 and insulin signaling intermediates expression in control and high glucose-treated (50 mM, 48 hours) 3T3-L1 mature adipocytes. (A) mRNA levels. Data are means ± SEM of the ratio between each gene and cyclophilin expression at differentiation days 7 and 9. (B) Protein levels. Data are means ± SEM of the ratio between each protein and β-actin expression at differentiation days 7 and 9. Groups from (A) and (B) were compared by using the ANOVA for a single factor and Dunnett's test. Data from control cells at day 9 were compared to control cells at day 7 *. p < 0.05. Data from glucose-exposed groups were compared to their same day control group +. p < 0.05. The number of independent samples analyzed for (A) and (B) is ≥10 for each determination and condition evaluated.
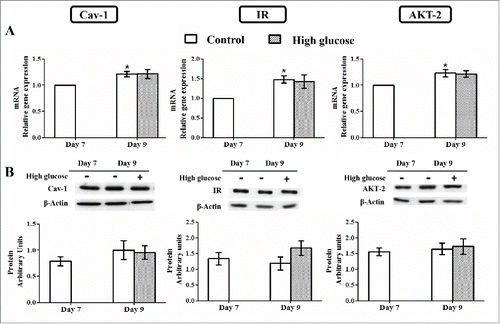
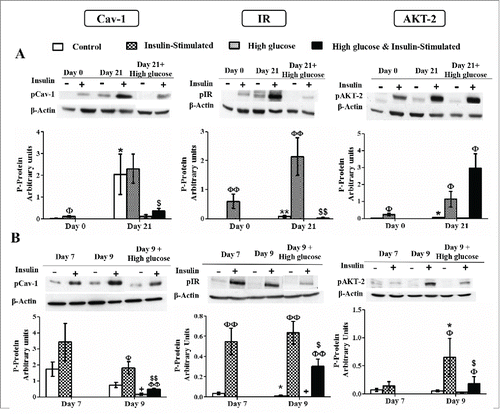
Figure 8. Caveolin-1 and insulin signaling intermediates activation during 3T3-L1 differentiation in the presence or in the absence of high glucose (50 mM) (A) and in control and high glucose-treated (50 mM, 48 hours) 3T3-L1 mature adipocytes (B). Results represent data from cells before and after stimulation with insulin (50 nM, 10 minutes). Data are means ± SEM of the ratio between each phospho-protein and β-actin expression at the differentiation days 0 and 21 (A) and at the differentiation days 7 and 9 (B). Groups were compared by using the Mann-Whitney test. Data from control cells at day 21 were compared to control cells at day 0 (A) and from control cells at day 9 were compared to control cells at day 7 (B) *. p < 0.05; **. p < 0.01. Data from glucose-exposed groups were compared to their same day control group +. p < 0.05. Data from insulin-stimulated groups were compared to their unstimulated control group Φ. p < 0.05, ΦΦ. p < 0.01. Data from insulin-stimulated glucose-exposed group were compared to their same day insulin-stimulated control group $. p < 0.05; $$. p < 0.01. The number of independent samples analyzed for (A) and (B) is between 5–10 for each protein and condition evaluated.