4,451
Views
22
CrossRef citations to date
0
Altmetric
Research Paper

Flow cytometric single cell analysis reveals heterogeneity between adipose depots

, , &
Pages 112-123 | Received 07 Apr 2017, Accepted 10 Apr 2017, Published online: 28 Apr 2017

Figures & data

Figure 1. Single cell suspensions of buoyant adipocytes show distinct flow cytometric profiles to stromal vascular fraction cells. A – F. Adipose tissue was excised from intrascapular brown (BAT), subcutaneous inguinal (WAT:ING), visceral gonadal (WAT:GON), peri-renal (WAT:PR), mesenteric (WAT:MES), and epicardial (WAT:EC). G. The adipose tissue was minced in FACS buffer (PBS + 0.05% BSA) and then digested with 0.1% (w/v) collagenase II for one hour at 37°C. The mixture was pipetted multiple times and passed through a nylon filter. The solution was then centrifuged for 7min at 500 RCF. The buoyant, mature adipocytes were separated from the pelleted SVF using a transfer pipette. Phase contrast images of buoyant adipocytes are placed in the corner of each respective depot in A-F. Arrowheads indicate multi-locular adipocytes. Scale bar represents 50 µm. H and I. Cells from the SVF and buoyant adipocytes were analyzed according to their forward scatter (size) and side scatter (granularity) profile. Cells from both fractions were then stained for propidium iodide (PI) to gate live cells, CD45 for hematopoietic cells, F4/80 for macrophages, and Ter119 for erythroid cells.
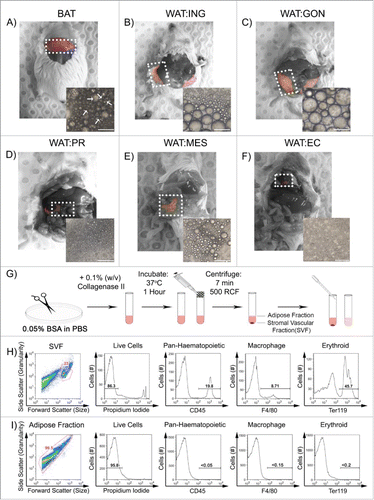
Figure 1. Single cell suspensions of buoyant adipocytes show distinct flow cytometric profiles to stromal vascular fraction cells. A – F. Adipose tissue was excised from intrascapular brown (BAT), subcutaneous inguinal (WAT:ING), visceral gonadal (WAT:GON), peri-renal (WAT:PR), mesenteric (WAT:MES), and epicardial (WAT:EC). G. The adipose tissue was minced in FACS buffer (PBS + 0.05% BSA) and then digested with 0.1% (w/v) collagenase II for one hour at 37°C. The mixture was pipetted multiple times and passed through a nylon filter. The solution was then centrifuged for 7min at 500 RCF. The buoyant, mature adipocytes were separated from the pelleted SVF using a transfer pipette. Phase contrast images of buoyant adipocytes are placed in the corner of each respective depot in A-F. Arrowheads indicate multi-locular adipocytes. Scale bar represents 50 µm. H and I. Cells from the SVF and buoyant adipocytes were analyzed according to their forward scatter (size) and side scatter (granularity) profile. Cells from both fractions were then stained for propidium iodide (PI) to gate live cells, CD45 for hematopoietic cells, F4/80 for macrophages, and Ter119 for erythroid cells.

Figure 2. Nile Red is a cell-permeable lipophilic sensor of intracellular lipid droplets useful for flow cytometry. A. Buoyant mature adipocytes were analyzed according to their size and granularity. Buoyant mature adipocytes were stained with: B. Classic lipid dye Oil Red O, C. Neutral lipid dyes; LipidTox® Red; LipidTox® Green and Nile Red. D. Buoyant mature adipocytes were gated according to their size and granularity (R1, R2, and R3) and Nile Red, PI, DRAQ5 and WGA fluorescence measured. Di. Mean fluorescence intensity (MFI ± SEM; n = 6) of Nile RedHigh was 2053 ± 152, Nile RedMid was 234 ± 32 and Nile RedLow was 41 ± 6.1. Dii. Cells from all 3 populations were PI negative (> 97.5% viable). Diii-iv. DRAQ5 and WGA fluorescence was greatest in Nile RedHigh cells (> 99%), while Nile RedMid and Nile RedLow exhibited DRAQ5 (> 87%) and WGA (> 70%) uptake.
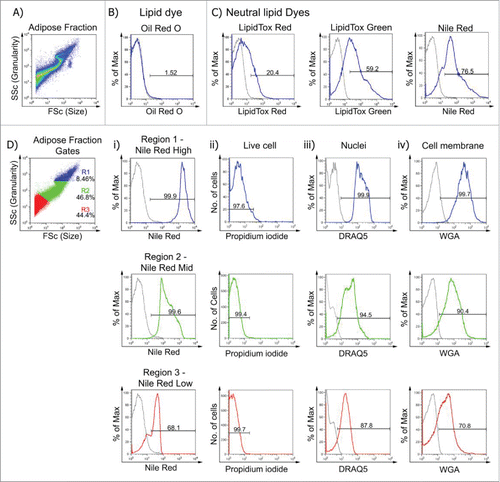
Figure 2. Nile Red is a cell-permeable lipophilic sensor of intracellular lipid droplets useful for flow cytometry. A. Buoyant mature adipocytes were analyzed according to their size and granularity. Buoyant mature adipocytes were stained with: B. Classic lipid dye Oil Red O, C. Neutral lipid dyes; LipidTox® Red; LipidTox® Green and Nile Red. D. Buoyant mature adipocytes were gated according to their size and granularity (R1, R2, and R3) and Nile Red, PI, DRAQ5 and WGA fluorescence measured. Di. Mean fluorescence intensity (MFI ± SEM; n = 6) of Nile RedHigh was 2053 ± 152, Nile RedMid was 234 ± 32 and Nile RedLow was 41 ± 6.1. Dii. Cells from all 3 populations were PI negative (> 97.5% viable). Diii-iv. DRAQ5 and WGA fluorescence was greatest in Nile RedHigh cells (> 99%), while Nile RedMid and Nile RedLow exhibited DRAQ5 (> 87%) and WGA (> 70%) uptake.

Figure 3. Mitochondrial membrane potential as assessed by Mitotracker® Deep Red fluorescence reveals heterogeneity in adipocytes from different depots. A. Confocal images of buoyant brown (left), white inguinal (middle) and gonadal (right) adipocytes stained with Nile Red (red), WGA (green) and MitoTracker® Deep Red (cyan). Scale bar represents 20 μm. B – D. Representative flow cytometric plot of MitoTracker® Deep Red uptake in BAT, WAT:ING, WAT:GON, WAT:PR, WAT:MES and WAT:EC depots according to Nile Red fluorescence (High, Mid and Low). Gating of MitoTracker® Deep Red was defined as MitoTracker−ve, MitoTrackerLow and MitoTrackerHigh. Bi,ii - Di,ii. Adipocytes from the Nile RedHigh, Nile RedMid and Nile RedLow gate of the 6 adipose depots were compared according to MitoTrackerLow and MitoTrackerHigh uptake in male mice (n = 6). Biii-iv – Diii-iv. Frequency of MitoTrackerLow and MitoTrackerHigh positive cells expressed as a proportion of adipose mass in the Nile RedHigh, Nile RedMid and Nile RedLow adipocyte populations. Data presented as mean ± SEM. Differences between adipose depots were determined by 2-tailed, one way ANOVA and pairwise post-hoc comparison by Tukey's HSD test. Groups sharing a numeral are not significantly different from each other.
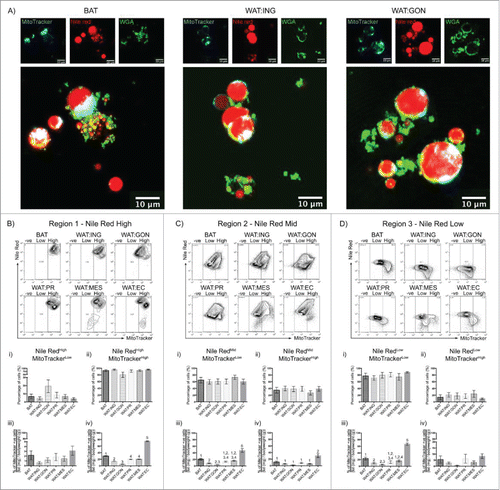
Figure 3. Mitochondrial membrane potential as assessed by Mitotracker® Deep Red fluorescence reveals heterogeneity in adipocytes from different depots. A. Confocal images of buoyant brown (left), white inguinal (middle) and gonadal (right) adipocytes stained with Nile Red (red), WGA (green) and MitoTracker® Deep Red (cyan). Scale bar represents 20 μm. B – D. Representative flow cytometric plot of MitoTracker® Deep Red uptake in BAT, WAT:ING, WAT:GON, WAT:PR, WAT:MES and WAT:EC depots according to Nile Red fluorescence (High, Mid and Low). Gating of MitoTracker® Deep Red was defined as MitoTracker−ve, MitoTrackerLow and MitoTrackerHigh. Bi,ii - Di,ii. Adipocytes from the Nile RedHigh, Nile RedMid and Nile RedLow gate of the 6 adipose depots were compared according to MitoTrackerLow and MitoTrackerHigh uptake in male mice (n = 6). Biii-iv – Diii-iv. Frequency of MitoTrackerLow and MitoTrackerHigh positive cells expressed as a proportion of adipose mass in the Nile RedHigh, Nile RedMid and Nile RedLow adipocyte populations. Data presented as mean ± SEM. Differences between adipose depots were determined by 2-tailed, one way ANOVA and pairwise post-hoc comparison by Tukey's HSD test. Groups sharing a numeral are not significantly different from each other.
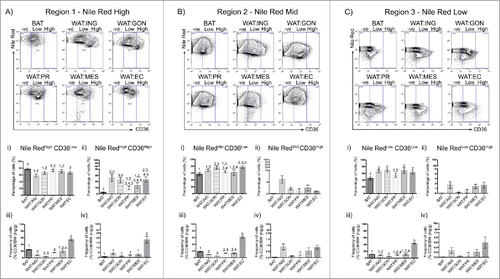
Figure 4. CD36 surface expression profiles vary across adipose depots. A – C. Representative flow cytometric plot of CD36 uptake in BAT, WAT:ING, WAT:GON, WAT:PR, WAT:MES and WAT:EC depots according to Nile Red fluorescence (High, Mid and Low). Gating of CD36 was defined as CD36−ve, CD36Low and CD36High. Ai,ii – Ci,ii. Adipocytes from the Nile RedHigh, Nile RedMid and Nile RedLow gate of the 6 adipose depots were compared according to CD36Low and CD36High uptake in male mice (n = 6). Aiii-iv – Ciii-iv. Frequency of CD36Low and CD36High positive cells expressed as a proportion of adipose mass in the Nile RedHigh, Nile RedMid and Nile RedLow adipocyte populations. Data presented as mean ± SEM. Differences between adipose depots were determined by 2-tailed, one way ANOVA and pairwise post-hoc comparison by Tukey's HSD test. Groups sharing a numeral are not significantly different from each other.

Figure 4. CD36 surface expression profiles vary across adipose depots. A – C. Representative flow cytometric plot of CD36 uptake in BAT, WAT:ING, WAT:GON, WAT:PR, WAT:MES and WAT:EC depots according to Nile Red fluorescence (High, Mid and Low). Gating of CD36 was defined as CD36−ve, CD36Low and CD36High. Ai,ii – Ci,ii. Adipocytes from the Nile RedHigh, Nile RedMid and Nile RedLow gate of the 6 adipose depots were compared according to CD36Low and CD36High uptake in male mice (n = 6). Aiii-iv – Ciii-iv. Frequency of CD36Low and CD36High positive cells expressed as a proportion of adipose mass in the Nile RedHigh, Nile RedMid and Nile RedLow adipocyte populations. Data presented as mean ± SEM. Differences between adipose depots were determined by 2-tailed, one way ANOVA and pairwise post-hoc comparison by Tukey's HSD test. Groups sharing a numeral are not significantly different from each other.

Figure 5. Changes in adipocyte surface phenotype and mitochondrial membrane potential during pregnancy. A. Comparing the mass of BAT, WAT:ING, WAT:GON, WAT:PR, WAT:MES and WAT:EC adipose tissue relative to bodyweight in male (n = 6), virgin (n = 6) and pregnant (n = 6) female mice. B. Expression of CD36 as a proportion of tissue mass in mature adipocytes. BAT, WAT:ING, WAT:GON, WAT:PR, WAT:MES and WAT:EC from male (n = 6), virgin (n = 6) and pregnant (n = 6) female mice were compared. C. Comparing uptake of MitoTracker® Deep Red as a proportion of tissue mass in mature adipocytes. BAT, WAT:ING, WAT:GON, WAT:PR, WAT:MES and WAT:EC from male (n = 6), virgin (n = 6) and pregnant (n = 6) female mice were compared. Data presented as mean ± SEM. Differences between adipose depots were determined by 2-tailed, 2-way ANOVA and pairwise post-hoc comparison by Tukey's multiple comparison test. Groups sharing a numeral are not significantly different from each other.

Figure 5. Changes in adipocyte surface phenotype and mitochondrial membrane potential during pregnancy. A. Comparing the mass of BAT, WAT:ING, WAT:GON, WAT:PR, WAT:MES and WAT:EC adipose tissue relative to bodyweight in male (n = 6), virgin (n = 6) and pregnant (n = 6) female mice. B. Expression of CD36 as a proportion of tissue mass in mature adipocytes. BAT, WAT:ING, WAT:GON, WAT:PR, WAT:MES and WAT:EC from male (n = 6), virgin (n = 6) and pregnant (n = 6) female mice were compared. C. Comparing uptake of MitoTracker® Deep Red as a proportion of tissue mass in mature adipocytes. BAT, WAT:ING, WAT:GON, WAT:PR, WAT:MES and WAT:EC from male (n = 6), virgin (n = 6) and pregnant (n = 6) female mice were compared. Data presented as mean ± SEM. Differences between adipose depots were determined by 2-tailed, 2-way ANOVA and pairwise post-hoc comparison by Tukey's multiple comparison test. Groups sharing a numeral are not significantly different from each other.

Table 1. Antibodies used in this study.

Table 2. Probes used in this study.

Reprints and Corporate Permissions

Please note: Selecting permissions does not provide access to the full text of the article, please see our help page How do I view content?

To request a reprint or corporate permissions for this article, please click on the relevant link below:

Academic Permissions

Please note: Selecting permissions does not provide access to the full text of the article, please see our help page How do I view content?

Obtain permissions instantly via Rightslink by clicking on the button below:

If you are unable to obtain permissions via Rightslink, please complete and submit this Permissions form. For more information, please visit our Permissions help page.