Figures & data
Figure 1. Common variants and regulatory features at human PLXND1. Four tracks are depicted at the PLXND1 locus. In descending order: WHRadjBMI Variants; 49 variants linked to rs10804591 (European ancestry, 1000G Phase 1, >0.7 R2 in linkage disequilibrium of rs10804591). Genes; Havana annotated genes. Arrows within the first exon indicate direction of transcription. All Variants; common variants from 1000 G Phase 1 with a frequency of at least 1% within populations of European ancestry. Regulatory Features; regulation marks predicted by the Ensembl Regulatory Build.Citation66 Vertical black bars are 100 kb (A) or 10 kb (B) apart. Brackets in A denote the region shown in B.
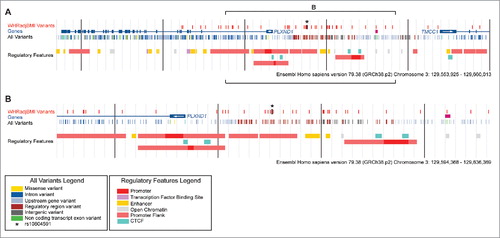
Figure 2. β-coefficients and standard deviation for rs10804591. Bar charts indicate the β-coefficients and standard deviation (SD) for rs10804591 for waist-hip ratio adjusted for BMI (A; WHRadjBMI), waist circumference adjusted for BMI (WCadjBMI), and hip circumference adjusted for BMI (C, HIPadjBMI). All data are taken from Shungin et al. (2015). Asterisks indicate genome-wide significance (P < 5 × 10⁻⁸). Data are classified into 3 groups; sex-combined (black bars), female-only (white bars), and male-only (gray bars). Data are from GWAS or metabochip (MC) cohorts as described in Shungin et al. (2015).
Figure 3. Fluorescent lipophilic dyes to study body fat distribution in zebrafish. Nile Red stained zebrafish demonstrating neutral lipid stored within ATs (labeled in yellow) at 2 developmental stages. The arrows indicate VAT. SL = standard length (a measure of the fish length from the snout to the caudal peduncle).
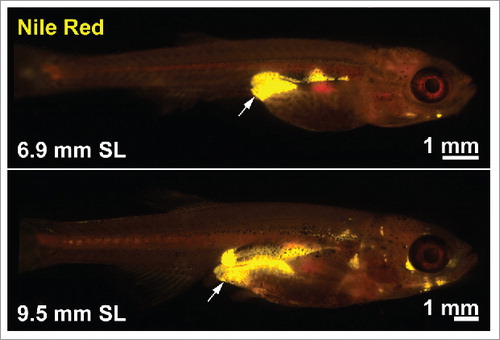
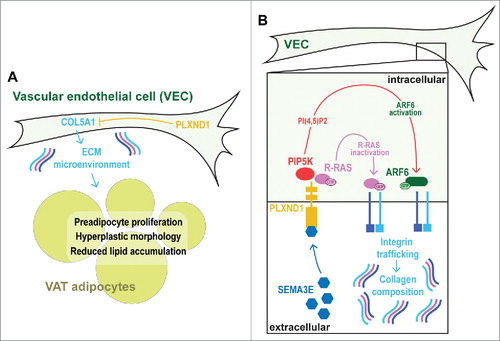
Figure 4. Schematic illustrating the hypothesized mechanism by which vascular endothelial cell-derived Plxnd1 determines ECM composition and VAT expandability. A. Overview of the hyperproliferative and hyperplastic microenvironment of plxnd1 mutant zebrafish VAT. B. Schematic on the interaction between PlxnD1, Integrins and ECM composition.